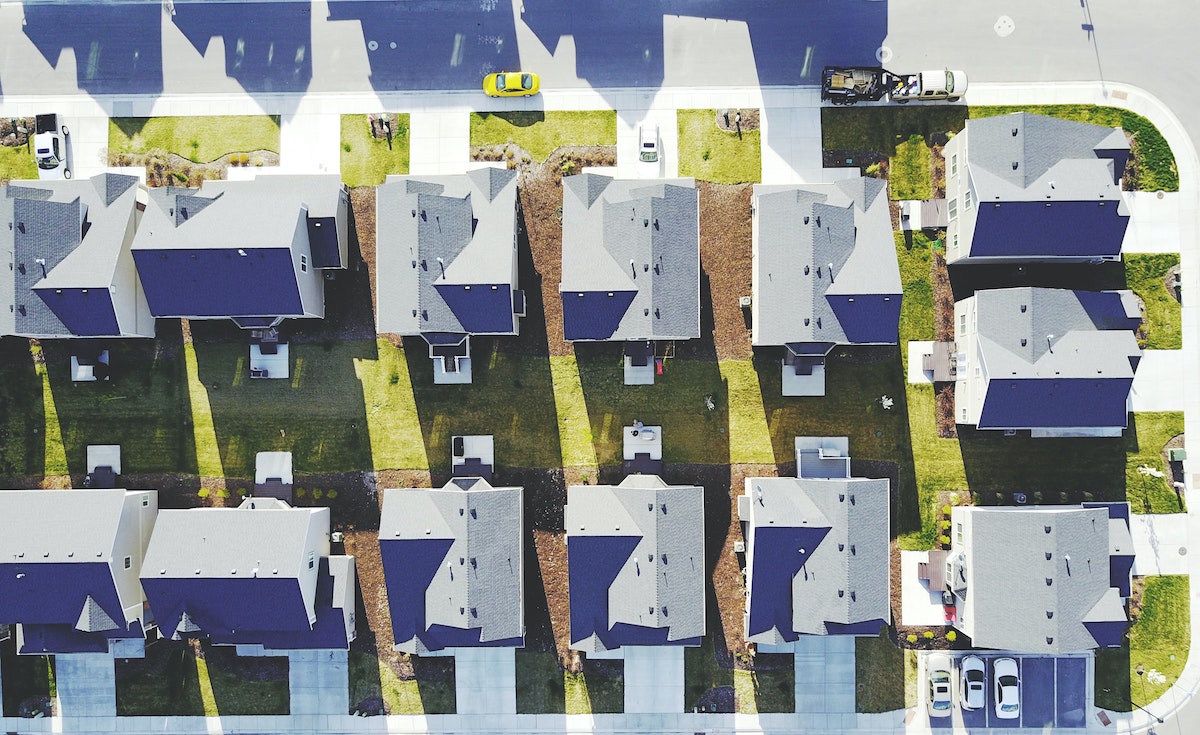
The construction of new homes is important to meet the shelter needs of America’s expanding population. CoreLogic public records data show that closings on single-family new-home sales were up 12% year-over-year in the six months before the pandemic hit. The pandemic derailed closings last spring, but only temporarily. Completions of one-family homes rebounded by summer, remained brisk the rest of 2020, and were the highest annual total since 2007.
The Dodge Momentum Index increased 3.1% in January to 139.4 (2000=100) from the revised December reading of 135.2. The Momentum Index, issued by Dodge Data & Analytics, is a monthly measure of the first (or initial) report for nonresidential building projects in planning, which have been shown to lead construction spending for nonresidential buildings by a full year. The commercial component of the Momentum Index moved 9.9% higher, offsetting an 11.7% decrease in the institutional component.
ATTOM Data Solutions’ new Q4 2020 U.S. Home Equity and Underwater Report shows there were 17.8 million residential properties in the U.S. considered equity-rich in the fourth quarter of 2020. According to the report, the combined estimated amount of loans secured by those properties was 50 percent or less of their estimated market value. ATTOM’s latest home equity and underwater analysis reported that the count of equity-rich properties in Q4 2020 represented 30.2 percent, or about one in three, of the 59 million mortgaged homes in the U.S. That figure was up from 28.3 percent in Q3 2020, 27.5 percent in Q2 2020 and 26.7 percent in Q4 2019.
ATTOM Data Solutions, curator of the nation’s premier property database, today released its fourth-quarter 2020 U.S. Home Equity & Underwater Report, which shows that 17.8 million residential properties in the United States were considered equity-rich, meaning that the combined estimated amount of loans secured by those properties was 50 percent or less of their estimated market value.
National home prices increased 9.2% year over year in December 2020, according to the latest CoreLogic Home Price Index (HPI®) Report. The December 2020 HPI gain was up from the December 2019 gain of 4% and was the highest year-over-year gain since February 2014. Price appreciation averaged 5.7% for full year 2020, up from the 2019 full year average of 3.8%. Home price growth in 2020 started off at a modest 4.3% rate in the first quarter, but as the pandemic limited supply throughout 2020, home price growth picked up, ending the year with an increase of 8.3% for the fourth quarter.
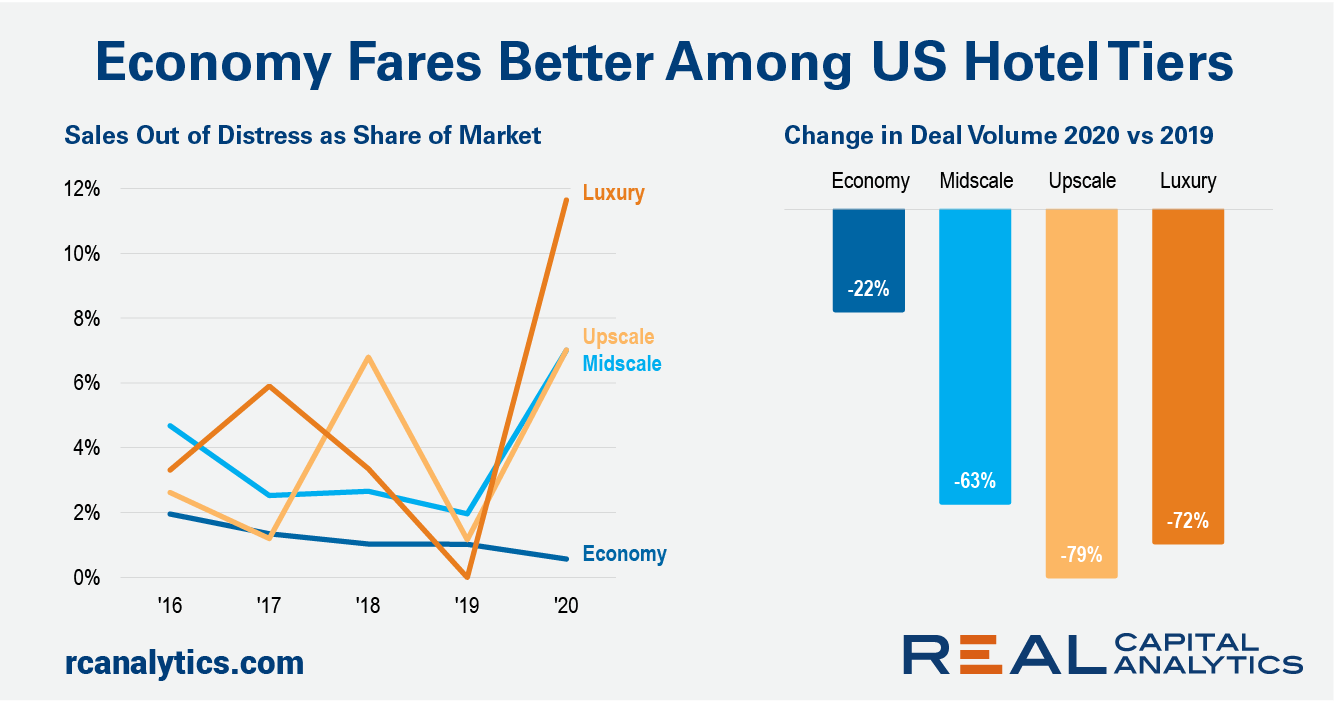
The pandemic hit the U.S. hotel sector hard in 2020. Between travel bans and the economic downturn, the impact to the sector which had already shown some cracks was swift and steep. Transaction volume in the sector fell by more than two-thirds compared with 2019, to the lowest level since 2009. However, the misery was not experienced equally across all chain scales. In 2020, investors had a clear preference for economy branded hotels.
ATTOM Data Solutions, curator of the nation’s premier property database, today released its Year-End 2020 U.S. Home Sales Report, which shows that home sellers nationwide in 2020 realized a home-price gain of $68,843 on the typical sale, up from $53,700 in 2019 and $48,500 two years ago. Profits rose in more than 90 percent of housing markets with enough data to analyze and the latest figure, based on median purchase and resale prices, marked the highest level in the United States since at least 2005.
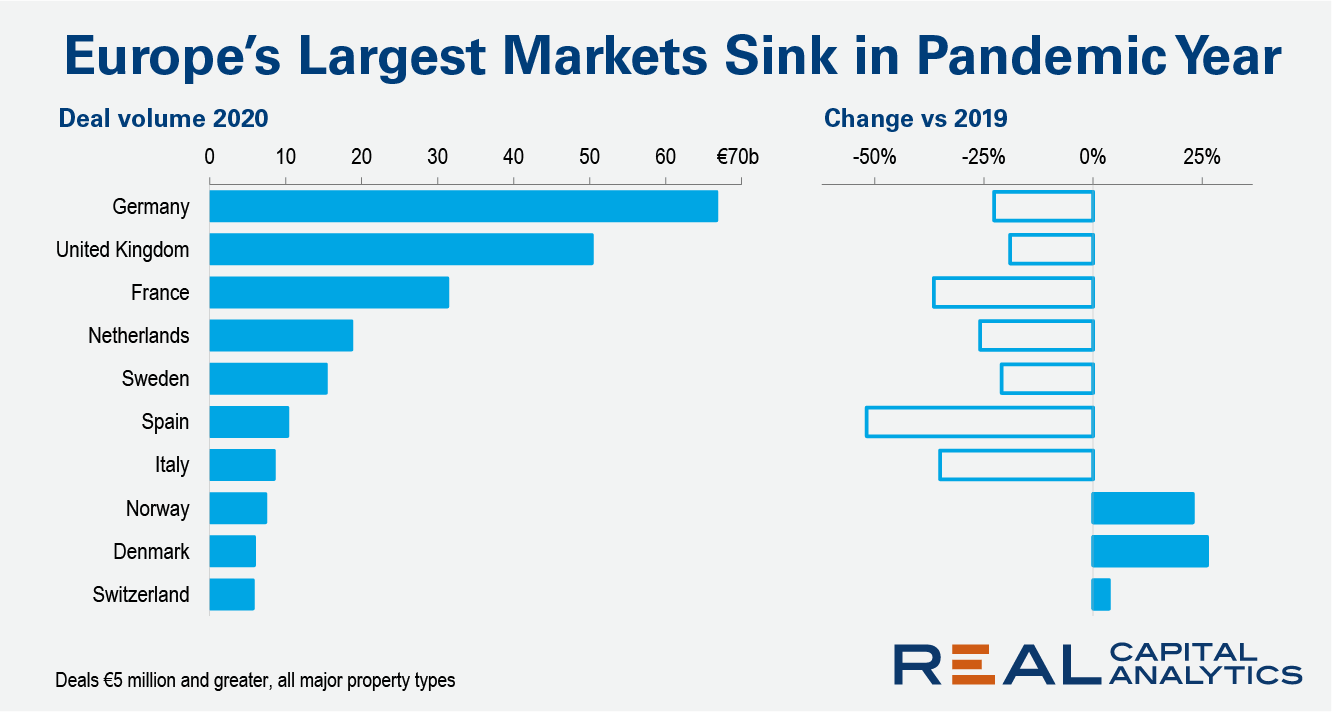
Commercial property sales activity in Europe tumbled by just over a quarter in 2020 in the face of challenges from the Covid-19 pandemic, with a steeper drop seen into the close of the year, the latest Europe Capital Trends report shows. Investment volume across all property types dropped 27% versus 2019. In the fourth quarter, activity was 44% lower than the same period a year earlier, when a record total of commercial property deals closed.
While COVID-19 impacted so many industries last year, real estate fared quite well. In the United States, home prices hit a record high in 2020 — just above $320,000, while the UK saw their average house price rise 7.6% compared to 2019. By forcing employees across the globe to work from home and students to learn from their bedrooms, many consumers began to flock away from cities and into the suburbs for more space.
The value of commercial and multifamily construction starts in the top 20 metropolitan areas of the U.S. lost 23% in 2020, falling to $111.1 billion according to Dodge Data & Analytics. Nationally, commercial and multifamily starts tumbled 20% over the year to $193.4 billion. Commercial and multifamily construction starts in the top 10 metro areas dropped 23% during the year with only one metro area — Phoenix AZ — reporting an increase.
2020 represented a dramatic shift from the type of multifamily performance industry participants had grown accustomed to in recent years. One theme was the particular difficulty experienced by the largest markets. Another was something of a flight to affordability made evident, in part, by the divergence in performance between the price classes.
According to ATTOM Data Solutions’ newly released Q4 2020 Special Coronavirus Report spotlighting county-level housing markets around the U.S. that are more or less vulnerable to the impact of the virus pandemic, pockets of the Northeast and other parts of the East Coast remained most at risk in Q4 2020, while the West continued to be less vulnerable.
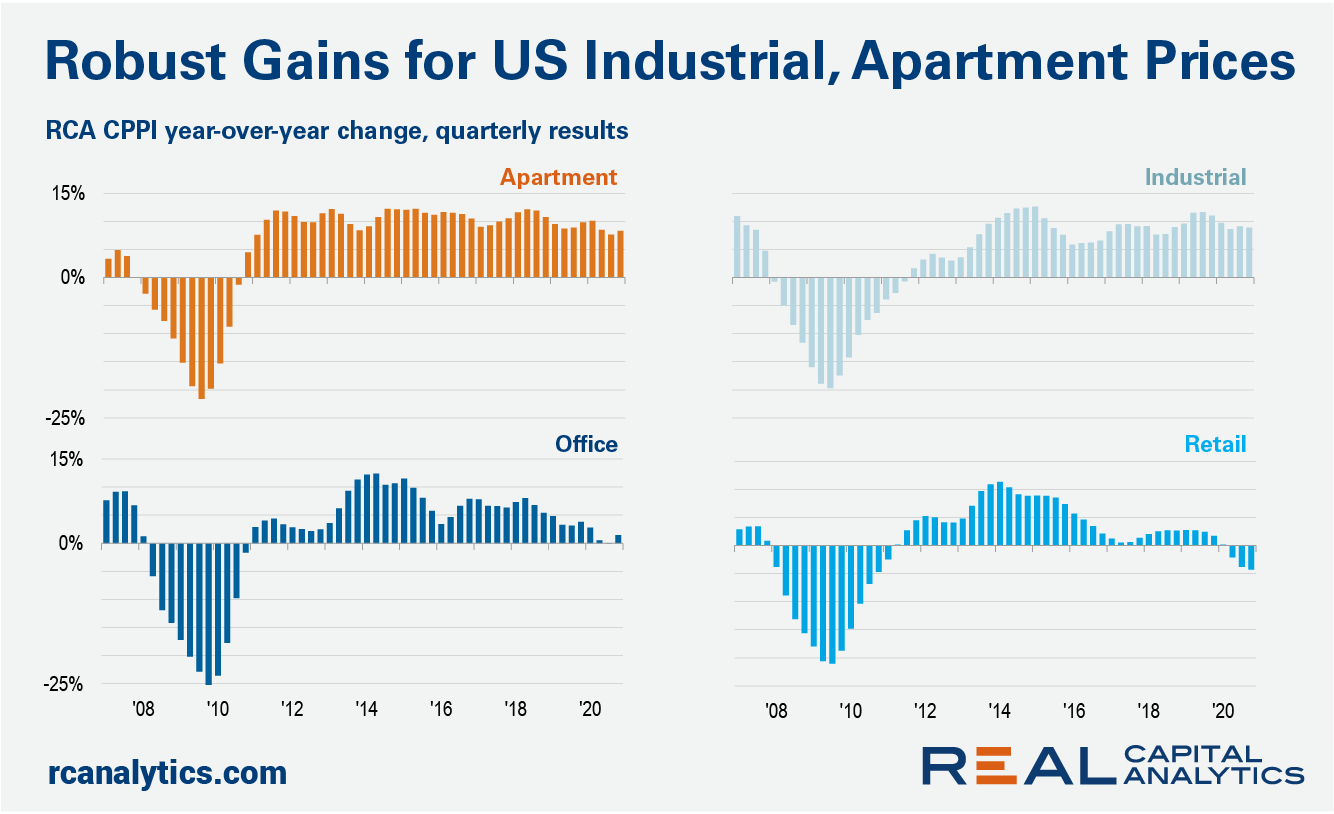
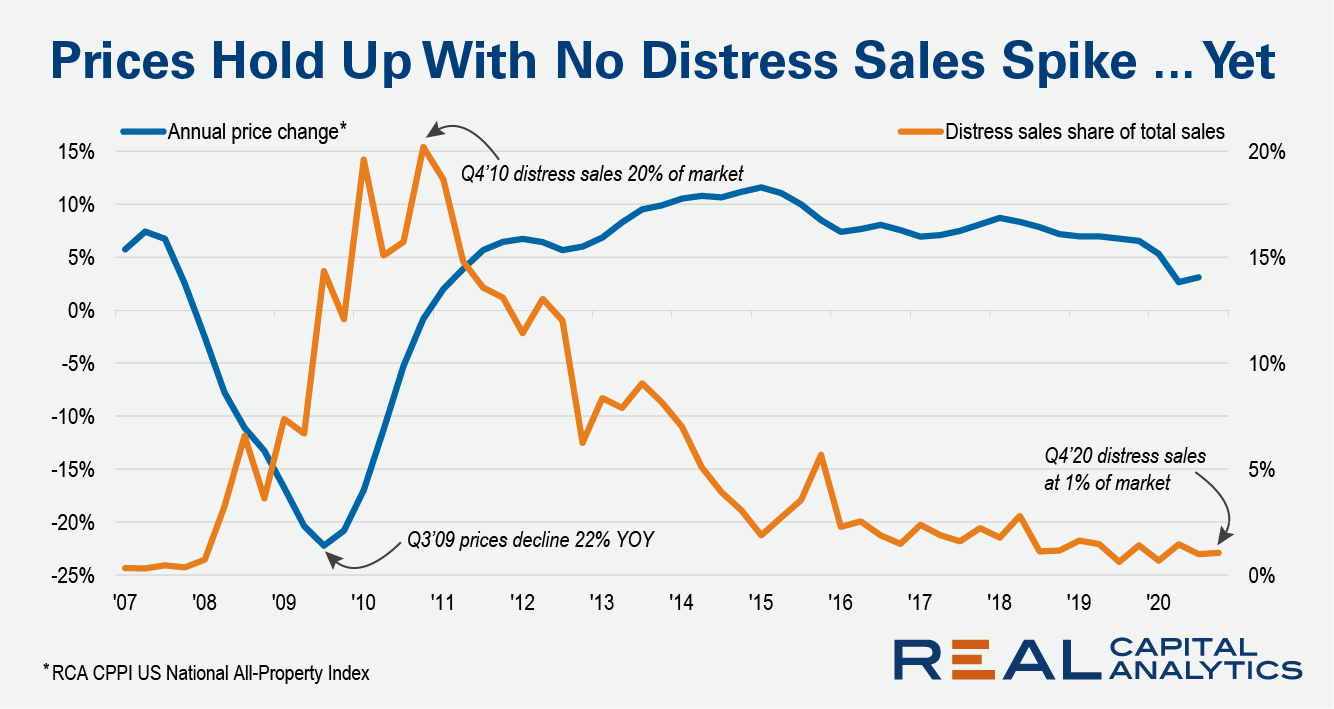
The headline rate of U.S. commercial property price growth accelerated into the last month of 2020, gathering strength on the back of robust apartment and industrial sector price increases. The US National All-Property Index grew 7.3% from a year earlier, the latest RCA CPPI: US summary report shows.
ATTOM Data Solutions, curator of the nation’s premier property database, today released its fourth-quarter 2020 Special Coronavirus Report spotlighting county-level housing markets around the United States that are more or less vulnerable to the impact of the virus pandemic. The report shows that pockets of the Northeast and other parts of the East Coast remained most at risk in the fourth quarter – with clusters in the New York City and Philadelphia, PA areas – while the West continued to be less vulnerable.
Housing activity ended 2020 on a strong note with increases across almost all major indicators.New construction activity was a bright spot for the economy in 2020. Single-family housing authorizations increased 13.97% year over year and 3.21% month over month. The housing market, however, is still experiencing some growing pains with inventory hitting record lows in December. New construction is expected to continue into 2021 to help curb tight housing supply.
U.S. single-family rent growth strengthened in November, increasing 3.7% year over year, showing solid improvement from the low of 1.4% reported for June 2020, and up from the 2.8% rate recorded for November 2019.
2020 was a whirlwind of a year for the CMBS and commercial real estate segments measured by unprecedented changes dictating how we live and do business, unlike any other economic disruption we’ve seen before. Read on for the winners, biggest surprise trades, biggest rebounds, bright spots among the distress, the "unknowns," and more.
A common theme in the media for December was that we lived through a horrible year in 2020 and that 2021 would be better for us all. Perhaps this sentiment will hold by year-end but the start has been chaotic. Conditions might become more distressing for commercial real estate investors throughout the year, a turn of events that some players are hoping to see.
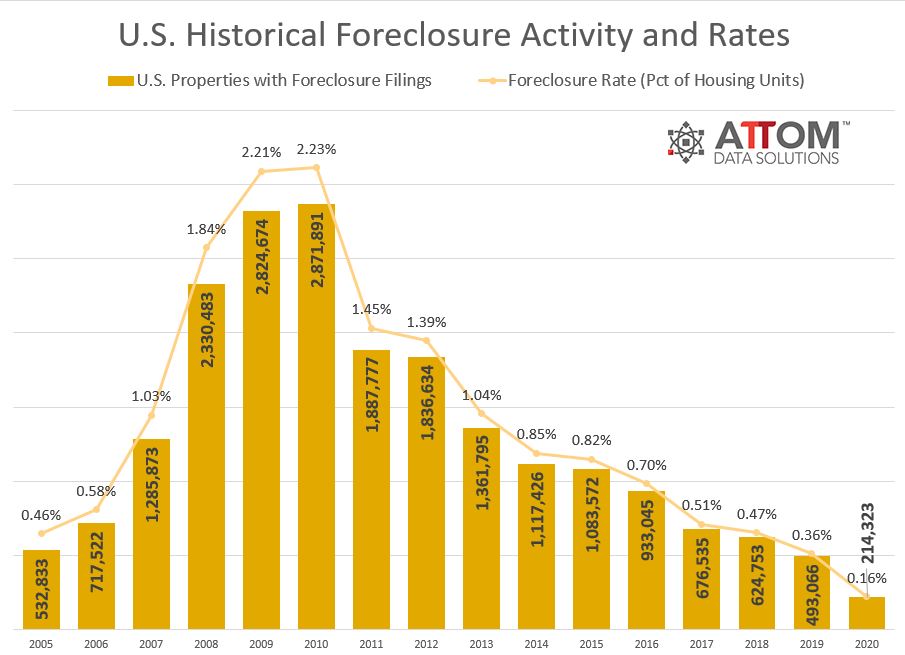
Foreclosure filings— default notices, scheduled auctions and bank repossessions — were reported on 214,323 U.S. properties in 2020, down 57 percent from 2019 and down 93 percent from a peak of nearly 2.9 million in 2010, to the lowest level since tracking began in 2005.
The COVID-19 pandemic made housing affordability a persistent concern throughout 2020. And as we enter the new year, rent payments remain a financial obstacle for many families. According to our latest survey, 30 percent of renters did not make their January payment on-time at the start of the year. This is down just slightly from the mid-summer peak when unemployment was at its worst, but up significantly from historic baseline levels.


