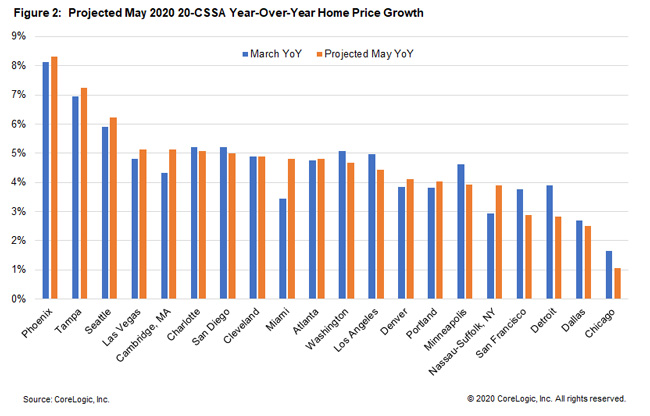
The newly released CoreLogic HPI for May shows that home prices held up very well in the United States. However, most of the home prices captured in the May report were from transactions negotiated in April or March since it takes on average 30 to 45 days to settle a transaction. Many states have entered different reopening phases since the beginning of May, and as a result housing market activity has increased. What does that mean for June or even July home prices?
The Dodge Momentum Index dropped 6.6% in June to 121.5 (2000=100) from the revised May reading of 130.1. The Momentum Index, issued by Dodge Data & Analytics, is a monthly measure of the first (or initial) report for nonresidential building projects in planning, which have been shown to lead construction spending for nonresidential buildings by a full year. The institutional component of the Momentum Index fell 11.7% while the commercial component declined by 3.5%.
Amazingly, we’re now passed the halfway mark of 2020. The first six months of the year have been turbulent to say the least, and the first of a few different perspectives from which we’ll evaluate how multifamily has performed so far this year is from a regional perspective.
32 percent of Americans did not make a full on-time housing payment in July, up slightly from 30 percent in June. Missed payments continue to concentrate among renters, young and low-income households, and residents of dense urban areas. Compared to last month more Americans are concerned about evictions and foreclosures, even as federal and certain local displacement protections are extended.
National home prices increased 4.8% year over year in May 2020, according to the latest CoreLogic Home Price Index (HPI®) Report. The May 2020 HPI gain was up from the May 2019 gain of 3.6%. Strong demand, especially by younger home buyers, and low supply helped push home prices higher in May. The economic downturn that started in March 2020 is predicted to cause a 6.6% drop in the HPI by May 2021, which would be the first decrease in annual home prices in over 9 years.
As we reach the midpoint of 2020, the picture of commercial real estate transactions completed globally continues to worsen, Real Capital Analytics data indicates. Activity in the Americas is falling back more severely than seen earlier in the year. Cumulative volume in the Americas at day 170 is now down 30% from a year ago.
The housing-market boom that pushed home prices upward for eight-years throughout the United States sputtered abruptly in May 2020 in large swaths of the country – the first sign that the worldwide Coronavirus pandemic is damaging property values across the nation. New sales figures from ATTOM Data Solutions show that median home prices stayed the same or dropped from April to May of 2020 in 17 states, as well as in half the metropolitan areas with enough transactions to analyze.
he first half of 2020 was, in many ways, unprecedented. The COVID-19 pandemic had a profound impact on the economy as a whole, and on multifamily specifically. We’ve covered various aspects of that impact elsewhere on the ALN blog. In this space today, let’s consider how Texas multifamily performed in the first half of the year from a few different perspectives.
Despite millennials aging out of an urban lifestyle and people considering suburban living, demographic trends continue to favor multifamily demand at the moment. As the future of the economy remains uncertain, people are likely to prefer renting versus owning. This is especially true for graduating students with high debt, as they will prefer to rent due to the challenging nature of securing a mortgage.
Although shelter-in-place orders continue to loosen across the country, the number of new COVID-19 cases has begun to spike in recent days, signalling that the effects of the pandemic are far from behind us. And despite a surprising drop in the unemployment rate from April to May, a record number of Americans remain out of work, with new unemployment claims continuing to top one million per week.
The drivers of the current downturn in the economy and commercial property markets are distinct from those which led to the Global Financial Crisis (GFC). This Covid-19 downturn came on suddenly, while warning bells were ringing a number of years ahead of the collapse of the housing market in the last recession. The variation in drivers could lead to a faster race to the bottom for market prices this cycle.
Problems in the US housing sector abound. Credit quality for both US- and UK-based firms continues to deteriorate, but the moves are significantly more dramatic in the US, with average probability of default increasing 3% over the last month and 13% over the past year.
Central Paris tied Manhattan as the world’s most liquid market in the first quarter of 2020 after an exceptional period of dealmaking in the French capital. The latest update of the RCA Capital Liquidity Scores shows that the Covid-19 crisis arrived too late in the quarter to dent liquidity in either European or North American markets significantly.
The newly released CoreLogic March Home Price Index (HPI) shows that prior to the COVID-19 outbreak home prices were starting to heat up in most places in the United States. However, home prices captured in the March report were from transactions negotiated prior to the implementation of shelter-in-place mandates, and there was a wide expectation that the growth may have decelerated in response to this interruption in demand.
Based on web data, we have observed a notable deterioration in multifamily and single-family rentals trends during April-20.
COVID-19’s impact was so profound that even the Lease Over Lease Δ change did not exhibit the seasonal improvement in Apr-20 from Mar-20 levels for all publicly traded residential REITs (except one company that might be more focused on rate versus occupancy).
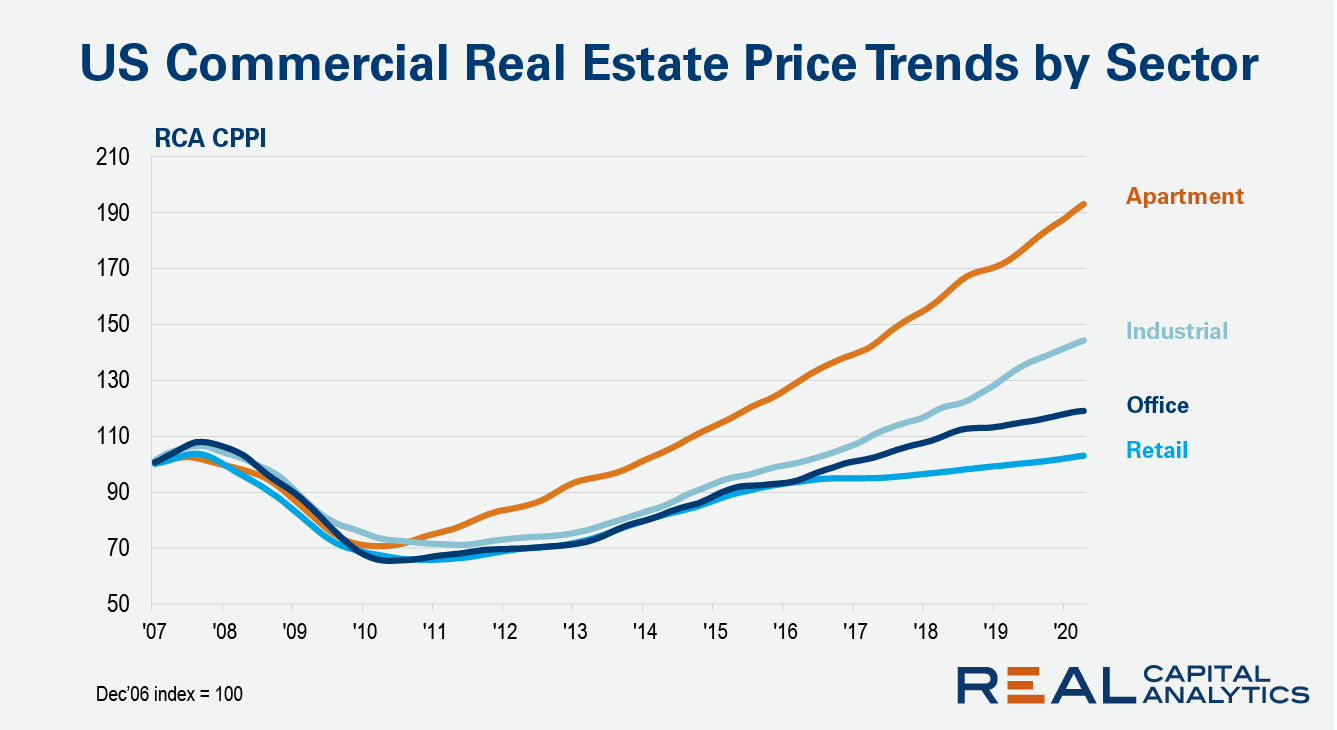
The headline rate of annual U.S. commercial property price gains came in at 6.5% in April, little changed from the growth rate seen in 2020 so far, the latest _RCA CPPI_ summary report shows. The US National All-Property Index gained 0.5% from March.
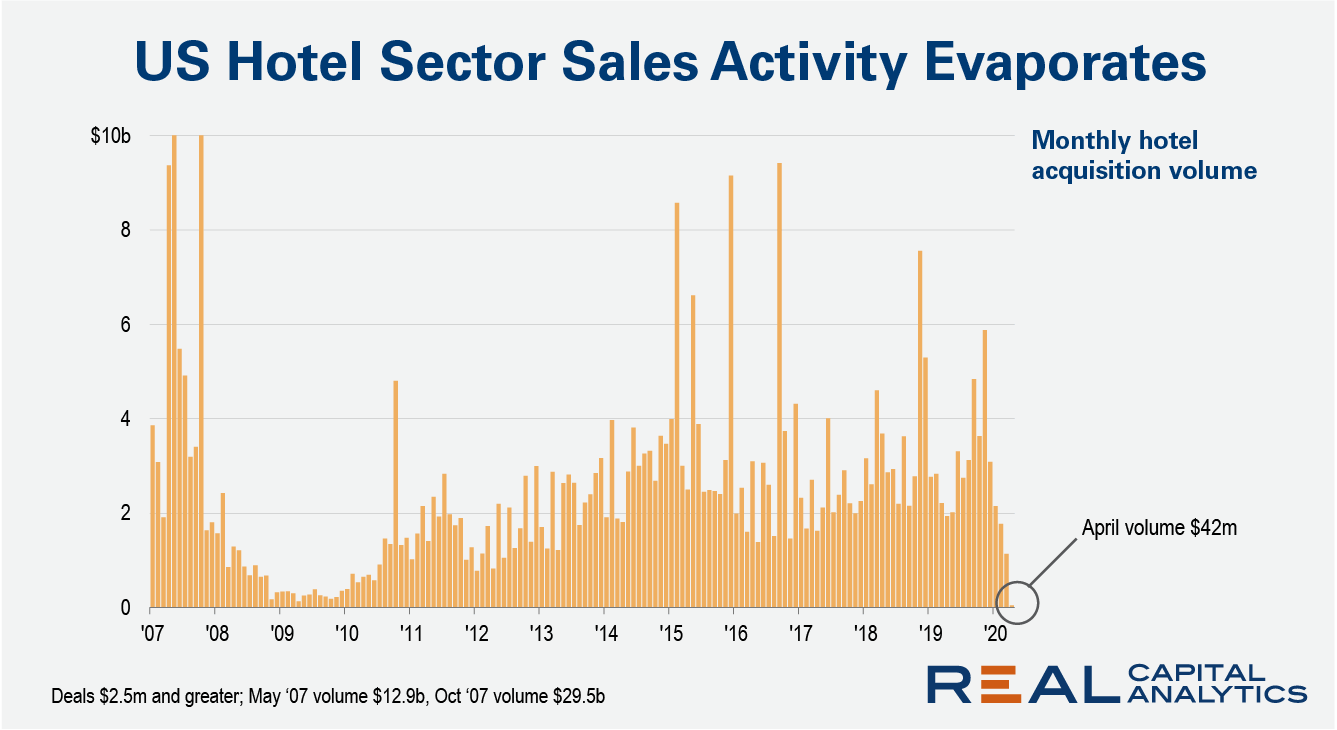
In the month of April fewer than 10 hotel properties changed hands across the entire U.S. We have never seen this level of illiquidity in the hotel market. It is effectively a frozen marketplace.
Hotel sector investment activity was already spinning downward even before the economic crisis wrought by Covid-19. A construction glut in key markets and challenges from upstarts such as Airbnb had put the sector under pressure.
ALN is conducting an ongoing survey of more than 60,000 conventional properties around the United States in effort to understand to what extent on-time full rent payments are being made and what measures properties are taking to work with their residents during this challenging and unprecedented period.
Our preliminary look at May data will focus on Texas and all numbers are derived from the responses of conventional properties with at least 50 units.
Our national rent index remained essentially flat from March to April, following two months of gradual increases. This flattening is occurring at a time when rent growth is normally picking up steam due to seasonality in the market. From 2016 to 2019, month-over-month rent growth from March to April ranged from 0.2 percent to 0.7 percent. The fact that we’re seeing rents level off at a time when growth normally speeds up is likely reflective of the continued uncertainty surrounding the COVID-19 pandemic.
The volume of completed commercial real estate transactions shows activity slowing across all regions, the latest Real Capital Analytics data reading indicates. Looking at the count of closed deals the picture is even gloomier, as the Covid-19 crisis takes its toll on commercial property markets worldwide.


