Total construction starts rose 48% in July to a seasonally adjusted annual rate of $1.36 trillion, according to Dodge Construction Network. This gain results from the start of three large manufacturing plants and two LNG export facilities. However, even without these projects, total construction starts would still have increased 7%. Nonresidential building starts rose 79% in July, and nonbuilding starts jumped 120%, conversely residential starts decreased 8%.
Off-price apparel was a pandemic winner, exhibiting remarkable imperviousness to some of the wider brick-and-mortar challenges. And now that the economic situation has shifted, off-price retailers remain an attractive option as consumers seek to refresh their wardrobes without breaking the bank. We took a look at the latest foot traffic data to understand how the combination of inflation, supply chain woes, and residual pandemic effects are continuing to drive visits to the sector.
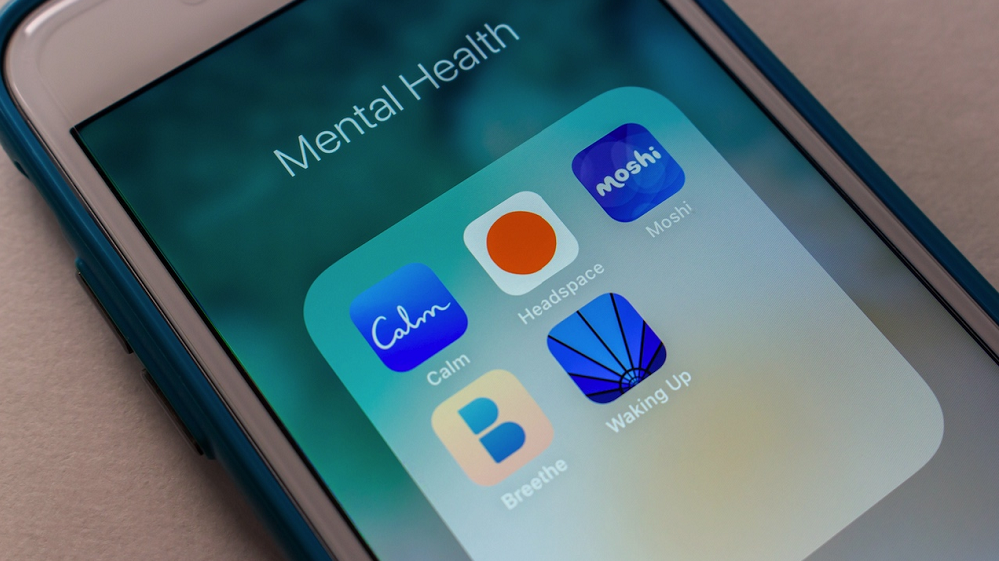
Calm just announced it is laying off 20% of its staff. The top two meditation apps have had a steady downward trend for engagement metrics since January 2021. User sessions of Calm are down 26.4% YoY in July, and Headspace is down a whopping 60.3%. As you can see in the graphic below, Calm did get a bump at the beginning of the year when almost all health & fitness apps have their best few months, but it started to decline dramatically shortly after Memorial Day.
Wholesale clubs like Costco Wholesale, BJ’s Wholesale Club, and Sam’s Club were some of the big winners of the pandemic’s shift to mission-driven shopping, and that strength carried throughout 2021. Early 2022 data indicated that the category was undergoing a mild correction following the record-breaking foot traffic numbers of the previous year. But comparisons to pre-pandemic metrics showed wholesale remaining strong despite the rise in inflation and gas prices. Now, as retail visitors continue tightening their budgets in the face of high consumer prices, we checked in to understand how the economic headwinds are impacting the three wholesale giants.
In last week’s earnings report, DIN reported rising sales at Applebee’s and IHOP among High Income shoppers making over $75,000 per year. They hypothesized that this was the result of those shoppers trading down from more expensive dining destinations as year-over-year inflation pressures continue. In today’s Insight Flash, we take advantage of our demographic data to see how high-income individuals have altered their spending in recent months. We look at overall spending by income group, deep dive into the restaurant sector, and examine changes in average ticket across subindustries for high income shoppers.
The top 10 quick-service restaurant apps in the U.S. were downloaded 12.1 million times in July, 16.3 percent more than those the month prior. Year-over-year in the month of July, downloads of the top 36 quick-service restaurant apps are up 42.2 percent. A download represents a new user and the first conversion on the mobile app customer’s journey.
Don’t let the recent job growth fool you—the US job market is a dumpster fire. In 2020, the unemployment rate reached 14.7%, the highest since The Great Depression. To add fuel to the fire, many people who received pink slips remained unemployed for more than a year. While the pandemic forced many cash-strapped companies to cut ties with people out of necessity, a lot of people left on their own accord. Enter the Great Resignation, the name used to describe the mass exodus of people quitting their jobs due to dissatisfaction related to pay, growth opportunities, benefits and more.
Home improvement was one of the more successful sectors throughout the pandemic. With lockdowns keeping people at home, many found the time to tackle DIY projects sending visits to home improvement retailers to all-time highs, significantly outperforming pre-pandemic numbers. Now, as lockdowns begin to fade into our memories and with inflation and gas prices causing people to think twice before opening their wallets, we checked in to see how the sector is faring.
Buy Now Pay Later (BNPL) is the latest reincarnation of consumer borrowing and has quickly dominated the conscience of the consumer, the media, concerned regulators and incumbent mobile/electronic payment platforms and wallets. Here, I briefly trace the origins of consumer debt for context and then bring the narrative forward to a current review of the BNPL landscape and what Fable’s consumer spend data is telling us about BNPL consumers and their usage, its popularity, the effect it is having on established payment providers and what this might mean for the future.
With inflation in both the US and UK forcing shoppers to trade down for cheaper goods in certain categories, is discount apparel retailer Primark seeing a tailwind from shoppers looking for cheaper apparel choices? In today’s Insight Flash, we look into Primark’s spend growth versus its broader industry and subindustry, trends in average basket, and which brands are most likely to be cross-shopped. In Primark’s core UK market, spend growth on a three-year basis outpaced the broader industry and subindustry pre-pandemic.
Competition for non-niche streaming video subscription apps is growing, but not just in terms of the number of players - in terms of actual performance. The fastest growing SVOD (subscription video on-demand) apps, by way of in-app purchase revenue, are Peacock TV, Paramount+ and discovery+. Over the past 12 months, they've grown by 133%, 107% and 25%, respectively.
Put lightly, the last few years have been volatile in the brick-and-mortar retail sector. Yet, Walmart and Target, two of the industry’s heavyweights have consistently overperformed. This included a strong showing in the spring of 2022 that came as COVID’s effects were dissipating, creating the sense that retail could finally enjoy a period of extended normalcy. Yet, that period barely had time to take off before rising gas prices and inflation began to impact consumer behaviors and spending.
As inflation continues to rise, many consumers are reportedly turning to discount stores for household essentials. Our competitive analysis of major discount retailers—including Five Below (NASDAQ: FIVE), Dollar General (NYSE: DG), Dollar Tree, Inc (NASDAQ: DLTR), and 99 Cents Only Stores—found that Five Below had the highest average transaction value, but Dollar General had the highest quarterly transactions per customer and quarter-over-quarter customer retention in the second quarter of 2022.
Two years after the first lockdowns, the return to office question still lingers. Cities and companies are anxious for office occupancy to return to pre-pandemic levels. The majority of workers, however, still prefer to work from home, whether fully remote or hybrid. As we enter the second half of the year, and as the shock of economic shifts brought on by inflation and gas prices levels out, we took a look at recent foot traffic data to offices to see how the sector is performing.
The Home Depot is climbing the ranks of Retail apps. For two quarters in a row, Home Depot gained twice as many new installs than direct competitor, Lowe's. It's was also the 11th most-downloaded Shopping app in the U.S. in Q2 2022, up from #20 a year ago. On average between the two home improvement competitors, Home Depot has pulled in 100% more monthly downloads since January. A paid App Store Optimization (ASO) keyword strategy appears to be a key driver to Home Depot’s comfortable margin ahead of Lowe's this year.
U.S. job growth soared in July, as the pandemic-impacted categories of leisure and hospitality bounced back to meet consumers’ continued demand for out-of-the-house experiences. But inflation continues to cut into spending power, with food inflation in particular remaining stubbornly high. We dove into retail foot traffic data to understand how the current dynamics are impacting key consumer-facing industries.
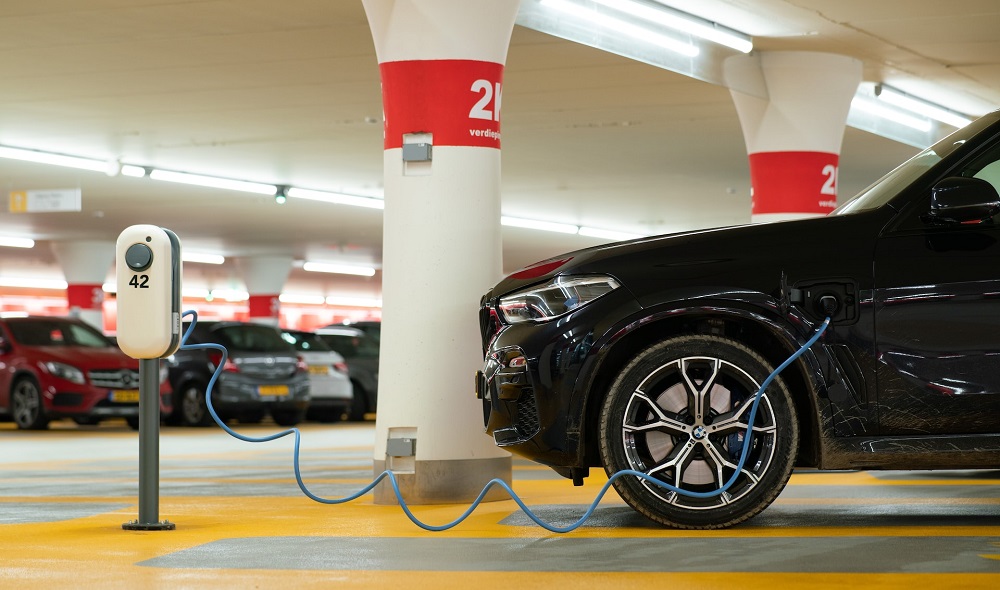
With gas prices surging over the last year, electric vehicles are looking more and more like an attractive alternative. But auto manufacturers aren’t the only ones to benefit from their increasing popularity – companies operating charging stations are also primed to take off. In today’s Insight Flash, we compare the success of three top charging station brands, looking at overall growth, changes in average ticket, and popularity by geography.
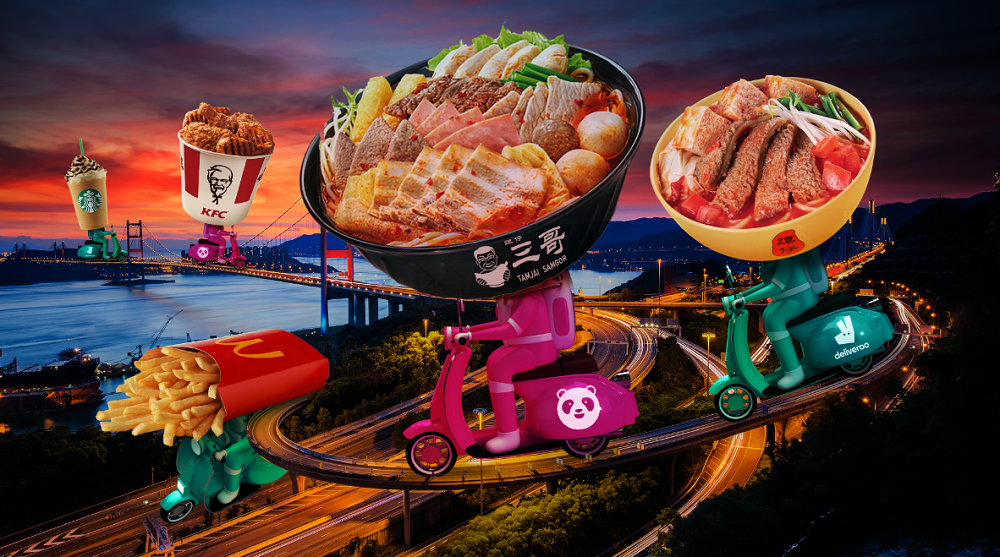
The Hong Kong food and restaurant industry is a monopoly whereby several companies own the majority of the businesses. As such, this makes it difficult to not walk into a restaurant chain in Hong Kong when you dine out. Similarly, on food delivery platforms, choices are limited to several big restaurant chains. Which restaurant chain is winning over the food delivery apps? According to Measurable AI’s transactional e-receipt data, McDonalds, KFC, TamJai, and Cafe de carol are some top restaurant chains on food delivery platforms Foodpanda(ETR: DHER) and Deliveroo(LON: ROO). Let’s look deeper into their market share on each platform.
The Dodge Momentum Index (DMI) increased 2.9% in July to 178.7 from the revised June figure of 173.6. The Momentum Index, issued by Dodge Construction Network, is a monthly measure of the initial report for nonresidential building projects in planning. The index is shown to lead construction spending for nonresidential buildings by a full year. In July, the commercial component of the Momentum Index rose 5.5%, while the institutional component fell 2.0%.
When we last looked at the Placer.ai Mall Indexes, a clear decline was taking place, driven heavily by high gas prices and continued inflation. Yet, at that time there was also an expectation that July could be even worse, in particular because of continued economic headwinds and in comparison to a very productive July 2021. Yet, the result was far more positive than expected.


