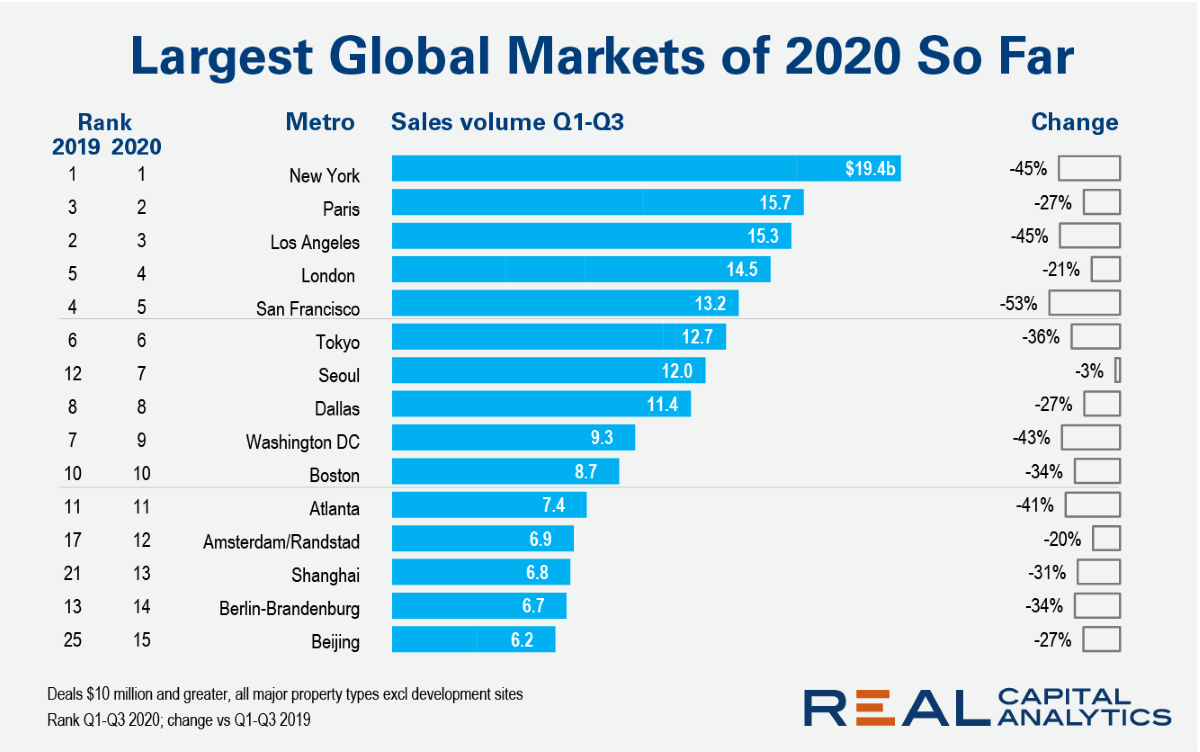
At the halfway point of 2020 there were a handful of top global metros that posted growth in deal activity versus the first half of 2019. One quarter on and there are no such positives in the list of the world’s largest metros. Seoul returned deal volume close to that of last year, but the market is still just in negative territory.
As we approach the end of the first week of lockdown 2.0, the Huq Index shows that footfall across the UK’s foodservice outlets appears to be holding stronger than it did when businesses were forced close earlier this year.
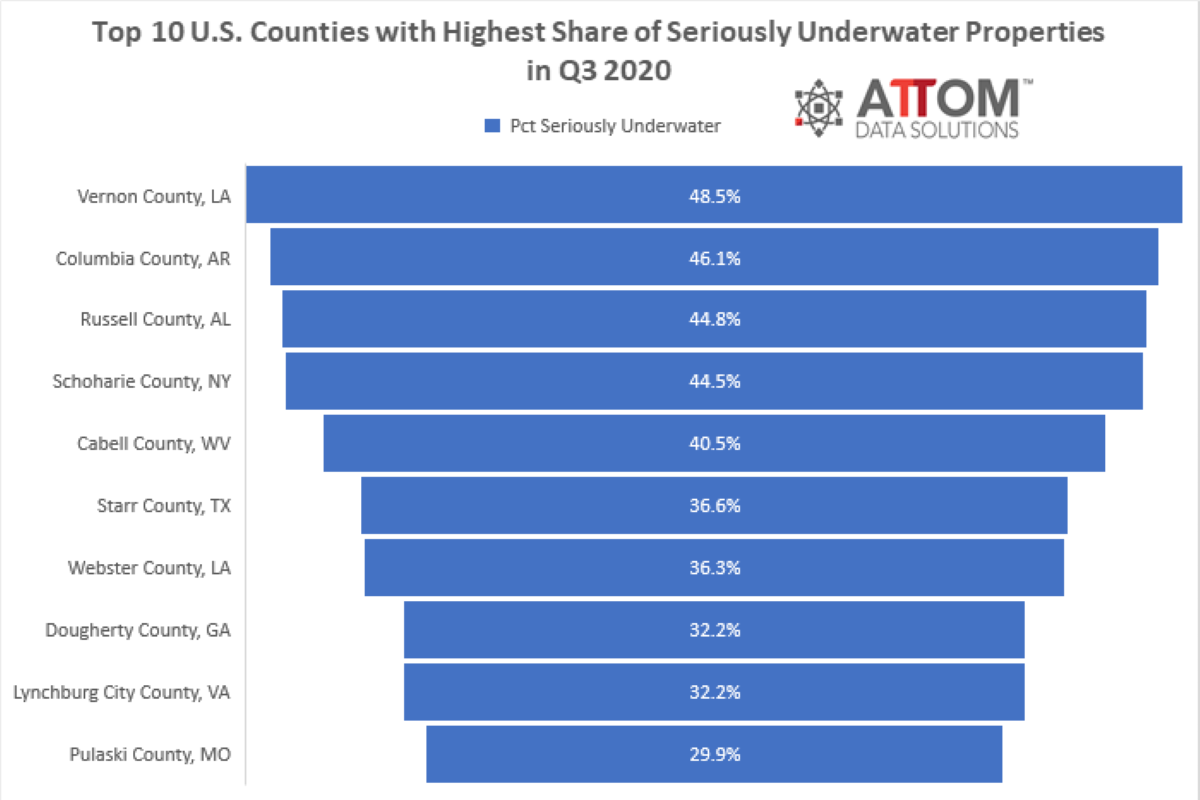
ATTOM Data Solutions’ just released Q3 2020 U.S. Home Equity and Underwater Report reveals that 16.7 million residential properties in the U.S. were considered equity-rich in the third quarter of 2020, while just 3.5 million mortgaged homes were considered seriously underwater.
The impact that coronavirus has had on our working lives in the last 8 months has been truly staggering. For a large portion of the workforce, the pandemic has brought about changes that range from a move to remote work to reduced hours or job loss. These massive shifts have left many struggling to find their footing amid an uncertain new reality.
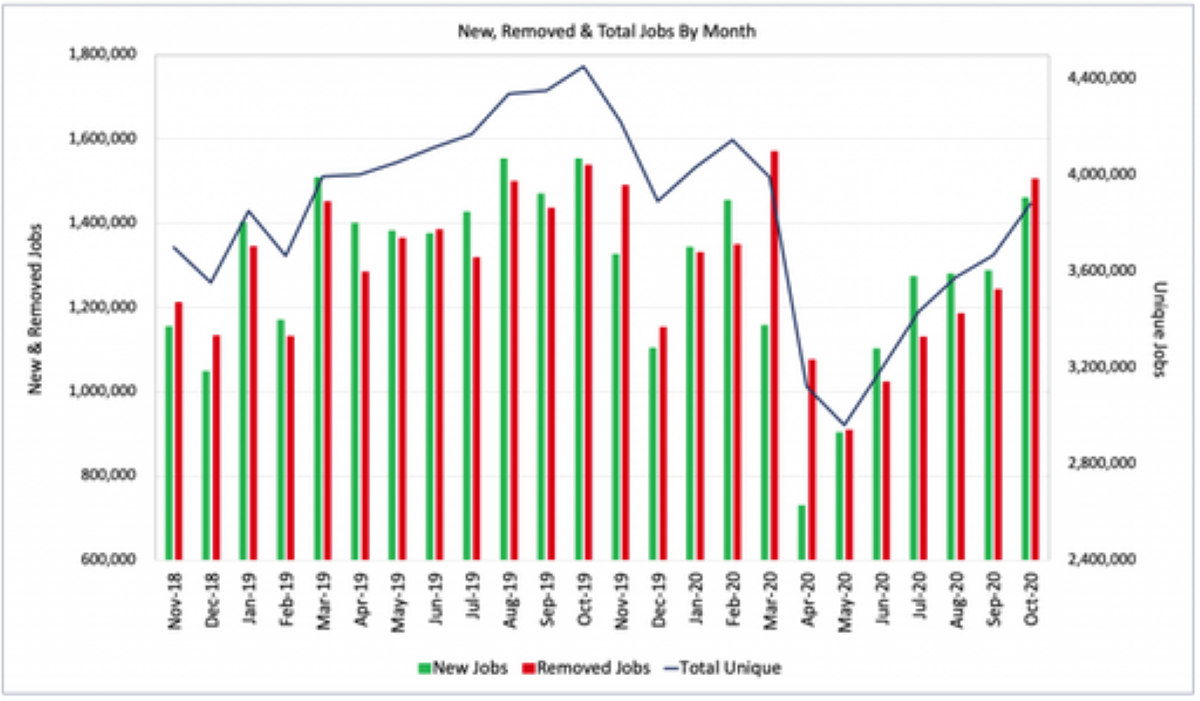
U.S. job openings on company websites globally rose 6% in October, continuing the steady recovery in U.S. labor demand that began in May. New Job listings posted to company websites rose 13% while the number of jobs removed from company websites, either because the jobs were filled or the employer no longer intended to fill the opening, rose 21%.
Equity-Rich Properties Now Outnumber Those Seriously Underwater by Almost Five-to-One Margin; Portion of U.S. Homes Considered Equity-Rich Grows to 28 Percent; Share of Seriously Underwater Properties Stay at 6 Percent
U.S. railroads originated 912,772 carloads in October 2020, down 6.6 percent, or 64,634 carloads, from October 2019. U.S. railroads also originated 1,169,874 containers and trailers in October 2020, up 10.0 percent, or 105,966 units, from the same month last year. Combined U.S. carload and intermodal originations in October 2020 were 2,082,646, up 2.0 percent, or 41,332 carloads and intermodal units from October 2019.
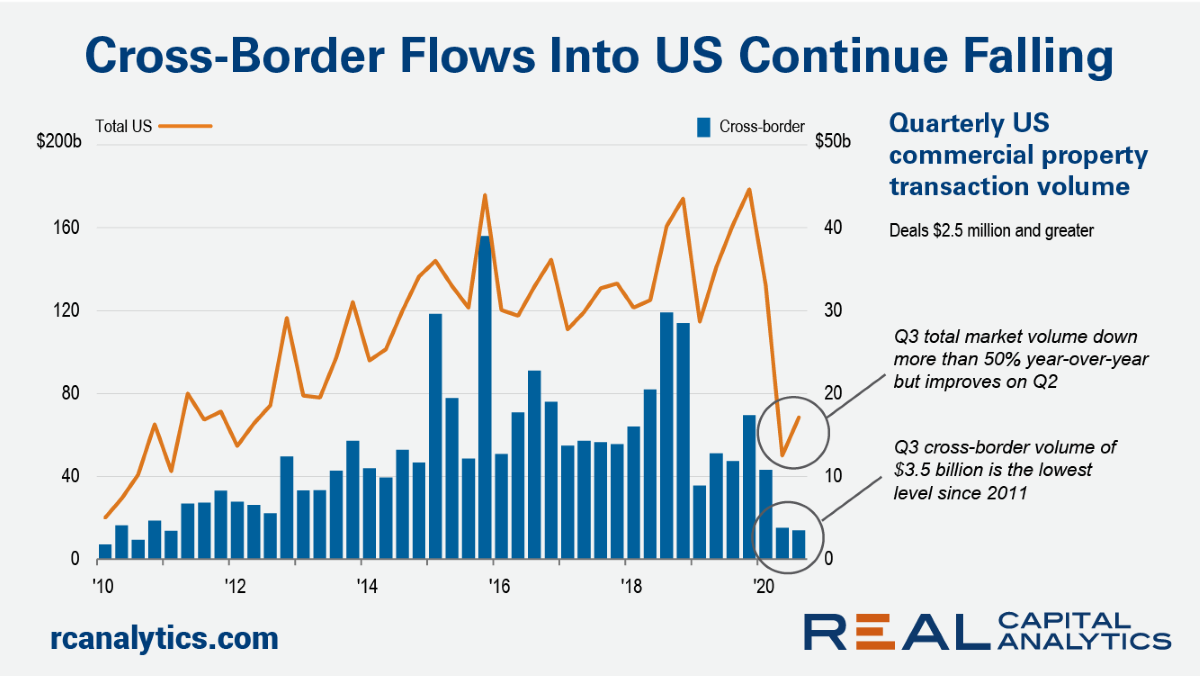
Total U.S. investment activity improved to some degree in Q3 2020, with sales volume up more relative to Q2 2020 than normal seasonal patterns would suggest. Not so for cross-border investment. Deal volume for cross-border buyers edged lower in the third quarter.
Not only has footfall into shops and stores declined during the pandemic, but customers are also visiting a less diverse mix of retailers as the crisis continues to drive change in retail behaviour. This new Huq Index measures the range of retail brands visited by customers within a category every week, and finds that loyalty increased by as much as 20% in the aftermath of the first lockdown.
National home prices increased 6.7% year over year in September 2020, according to the latest CoreLogic Home Price Index (HPI®) Report. The September 2020 HPI gain was up from the September 2019 gain of 3.5% and was the highest year-over-year gain since May 2014.
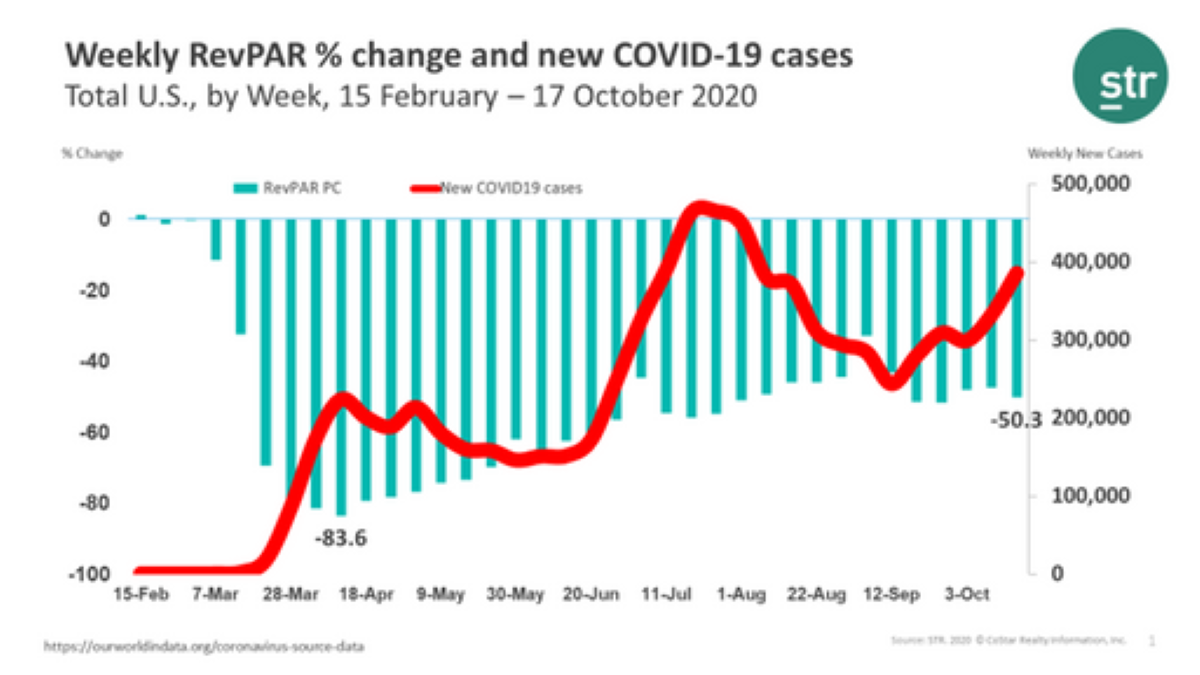
With new COVID cases on the rise and risk mitigation the name of the game, most companies will continue working from home and business travel will remain negligible, stymying further RevPAR improvement.
At the end of the third quarter, the count and volume of deals across the three global zones has fallen back even further as the Covid-19 pandemic grinds on. In the Americas, deal volume through the end of September was 41% lower than the same point in 2019, and the deal count 34% lower.
The presence of customers across all consumer industries in Europe fallen sharply over the last two weeks as countries across the continent introduce measures consistent with those seen during the first lockdown. This effect is most keenly felt across discretionary industries – particularly hospitality, accommodation, leisure and apparel.
Challenges in the energy sector are numerous and persistent. These challenges are perhaps most evident in the US energy sector, where strained prices and weakened demand have accompanied months of reduced travelling for professional and personal reasons. Bankruptcies are increasing. Some firms are doing better than others, yet few are in great shape.
The worst may not yet have arrived for the US auto industry. In fact, there were some signs of recovery in Q3. But when a smaller-than-expected drop in sales is considered a good sign, it’s no surprise the credit quality for the industry is still in poor shape. The UK is experiencing similar issues, and is also dealing with concerns about Brexit. What’s more, a growth in COVID cases continue to weigh on economic recovery in each country.
Welcome to the November 2020 National Apartment List Rent Report. With the peak summer renting season behind us, we are now entering the time of year when fewer moves normally take place, causing a seasonal dip in rent prices. And although this year’s peak season was significantly disrupted due to the COVID-19 pandemic, our national index has stabilized back to a more typical trend over the past few months.
Number of Zombie Foreclosures Drops 4 percent From Last Quarter; Percentage of Foreclosure Properties Sitting Empty Stays About the Same; Among All Residential Properties, Zombie Foreclosures Represent Just One of Every 13,100
Latin America has been making headlines of late regarding the rate that the Coronavirus is sinking its claws in some of its countries, more than others. Flights have been grounded. Borders closed. However, the latest data by ForwardKeys captures a glimpse of the silver lining.
U.S. consumer spending has been altered by the coronavirus pandemic. Our data reveals that consumers are changing the way they pay for goods and services, with some industries seeing spending shift toward online purchases. Additionally, the pandemic has changed the types of purchases consumers are making, with stimulus recipients increasing their spending on big-ticket items.
With the holidays top of mind, data from TSA shows that there is still a significant difference in the number of travelers passing through TSA checkpoints compared to a year ago. The daily average number of travelers passing through TSA checkpoints in 2019 was 2.4 million while in 2020 it is currently hovering around 570,000 a 76% decrease.