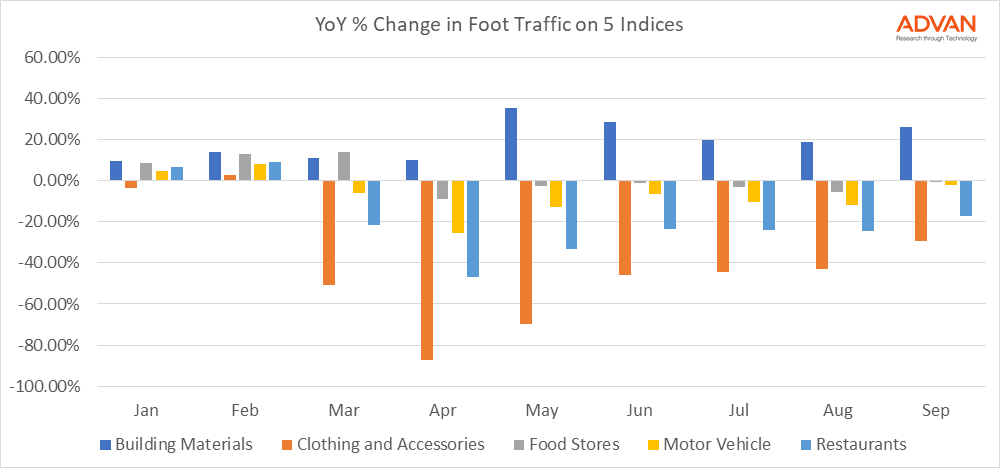
What does a COVID recovery look like for businesses? 6 months after the initial lock-down we know that, in the US, the journey has been remarkably different for different types of businesses. Our foot traffic indices capture trends that show just how varied the path has been. We looked at the percentage change in foot traffic for 5 different sectors during each month of this year.
With the cold and flu season on the horizon – and COVID-19 cases holding steady at a very high baseline – this trend is concerning. In Arkansas, where Kinsa’s Rt metric has been moderately elevated for several weeks, confirmed COVID cases are now beginning to rise. In neighboring Missouri, Greene County has also seen high illness transmission in recent weeks.
Visits to pubs across the UK took a tumble in September as the stimulus of Eat-Out-to-Help-Out appears to be running dry and large parts of the country face renewed restrictions. Huq’s Index for Restaurants & Pubs had identified signs of a positive recovery throughout August. However, the rate of growth has reversed in the last few weeks with visits halving in pubs. Restaurants and even QSR paint a similar picture.
Except for a few lonesome doves, general retailers in the US continue to struggle. Sales have returned to pre-pandemic levels, but the composition is different and recent sales recoveries were lower than anticipated. Consumer spending increases have been moderate. Something similar can be said for UK retail and for UK consumer spending. COVID-19 remains an issue for each country.
Residents in Birmingham, Bristol and Sheffield have been some of the fastest to return to workplaces, with office attendance climbing to almost 50% of YOY levels in each city. However, working from home appears to have become a new way of life for Londoners, as levels at languish around 20%. Commuting in cities outside London have been witnessing a fast recovery since the start of July as offices and workplaces were allowed to open up again.
As we mark half a year of grappling with COVID, one industry that has weathered major turmoil is Food Service. Looking at the data to determine the shape of the industry today, we see both positive and negative signs. Noted in our recent monthly recap, Accommodation and Food Services was the industry that saw the biggest decline in August, down -9.29% for the month. (Utilities was the only other industry down, while the other 87% of industries saw improvement.)
Year-over-year small business credit card application volume shrunk 41% in Q2 2020, but increased search activity signals renewed hope for the second half of 2020. New research found indications that interest from small businesses in small business credit cards may be rebounding after a loss in momentum in the first half of 2020.
Maize farmers across Europe face a range of production challenges. Fungal diseases on maize grain impacts yield, quality and in some cases create toxins such as aflatoxin in the case the Aspergillus flavus in maize that are extremely carcinogenic. Tools to monitor and mitigate the risk of these fungal diseases are key to ensuring food safety across Europe.
Equity markets used to ignore credit risk, but COVID has changed all that. There is a growing demand to understand corporate and financial credit risk at all levels, from single issuers and corporate families to sectors, industries and countries. How far do equity market movements reflect credit developments during the COVID crisis?
Data from the TSA and Opentable show that the Travel and Hospitality sectors have not recovered to pre-COVID levels. Given that the small improvement took place during the spring and summer months when the weather was more favorable and people typically travel for vacation, it is highly likely that a larger recovery is not seen until spring 2021. Data from TSA show that total travelers passing through TSA checkpoints at US airports is still at only 35% of the numbers recorded last year.
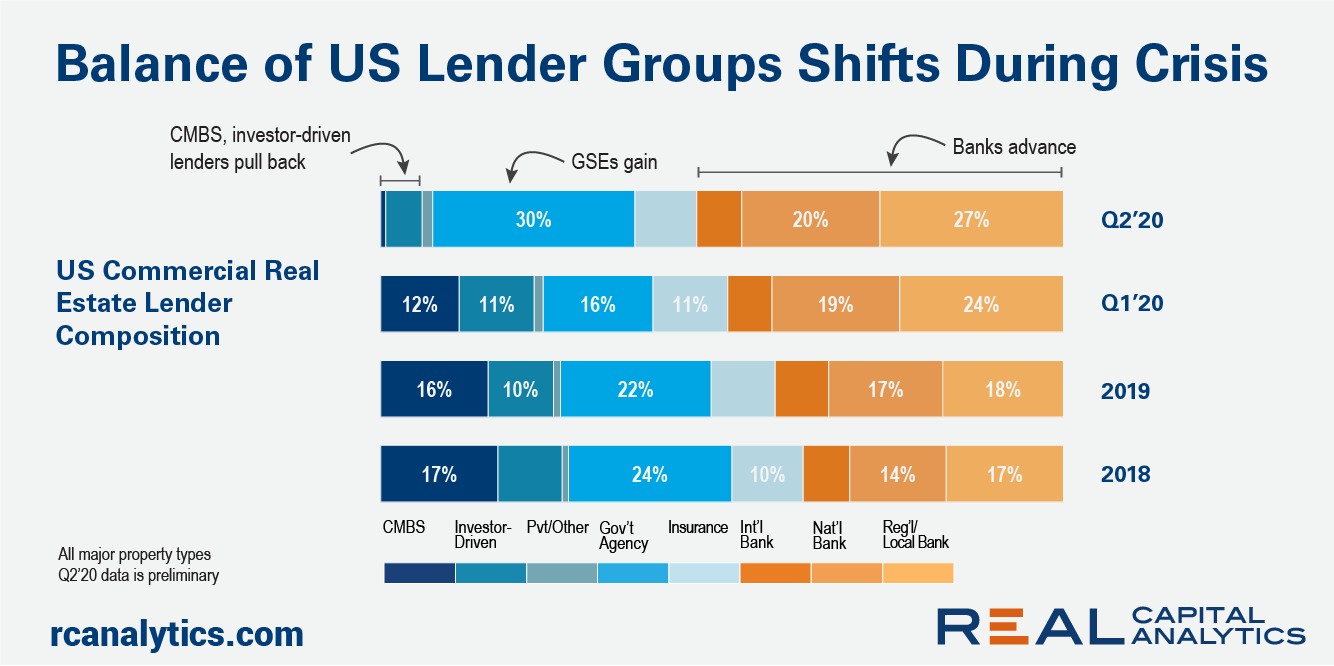
The debt portion of the U.S. capital stack has seen a tumultuous 2020. Key industry participants have pulled back on mortgage originations in response to the uncertainty around the Covid-19 recession. Commercial mortgage originations in the second quarter of 2020 were supported by banks and the GSEs. The debt portion of the capital stack is more stable today than it was in the last downturn.
Total construction starts rose 19% in August to a seasonally adjusted annual rate of $793.3 billion. Gains were seen in all three major building sectors: nonresidential building starts rose 16% and residential building climbed 12%, while nonbuilding construction jumped 40% over the month. While large projects certainly influenced the August gains, removing those projects would still have resulted in a gain for the month.
Some shutdowns in petrochemical infrastructure that took place before the August 27 landfall of Hurricane Laura are still in place, and the effects are reverberating through global olefin markets. US ethylene loadings so far this month are 11,642 metric tons. The hurricane struck near Lake Charles, Louisiana, and disrupted activity at several of the petrochemical plants located there including at Sasol, Westlake, Lotte and LyondellBasell.
U.S. consumer spending has been altered by the coronavirus pandemic. Our data reveals that consumers are changing the way they pay for goods and services, with some industries seeing spending shift toward online purchases. Additionally, the pandemic has changed the types of purchases consumers are making, with stimulus recipients increasing their spending on big-ticket items.
As Labor Day closed the books on what is arguably the strangest summer in modern history, we decided to take a peek in the rearview mirror and recap what happened over the last 90 days (or was it 90 years? What is time anyway?!?)
At a national level, Kinsa’s measure of illness transmission (Rt) is near 1, suggesting that COVID-19 case growth will remain relatively stable over the next few weeks. The current baseline of 40,000 new infections per day represents a dangerously high status quo as we head into the fall, when many experts fear that the start of the school year and colder weather will fuel case growth.
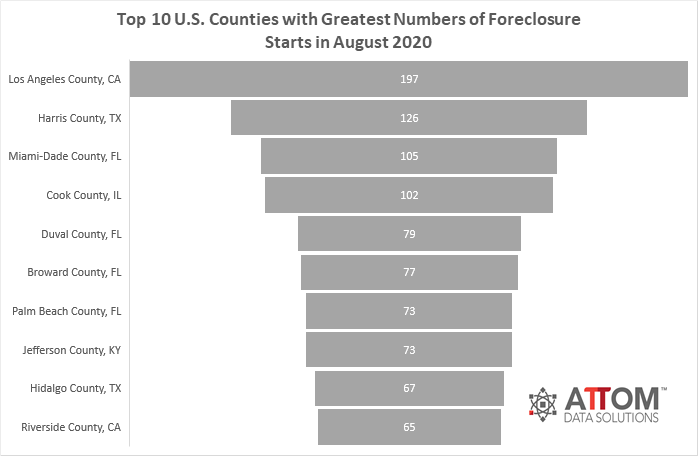
U.S. properties with foreclosure filings — default notices, scheduled auctions or bank repossessions — saw a slight uptick in August 2020 from July 2020, with 9,889 filings reported. That number increased monthly by 11 percent, but is still down 81 percent from last year.
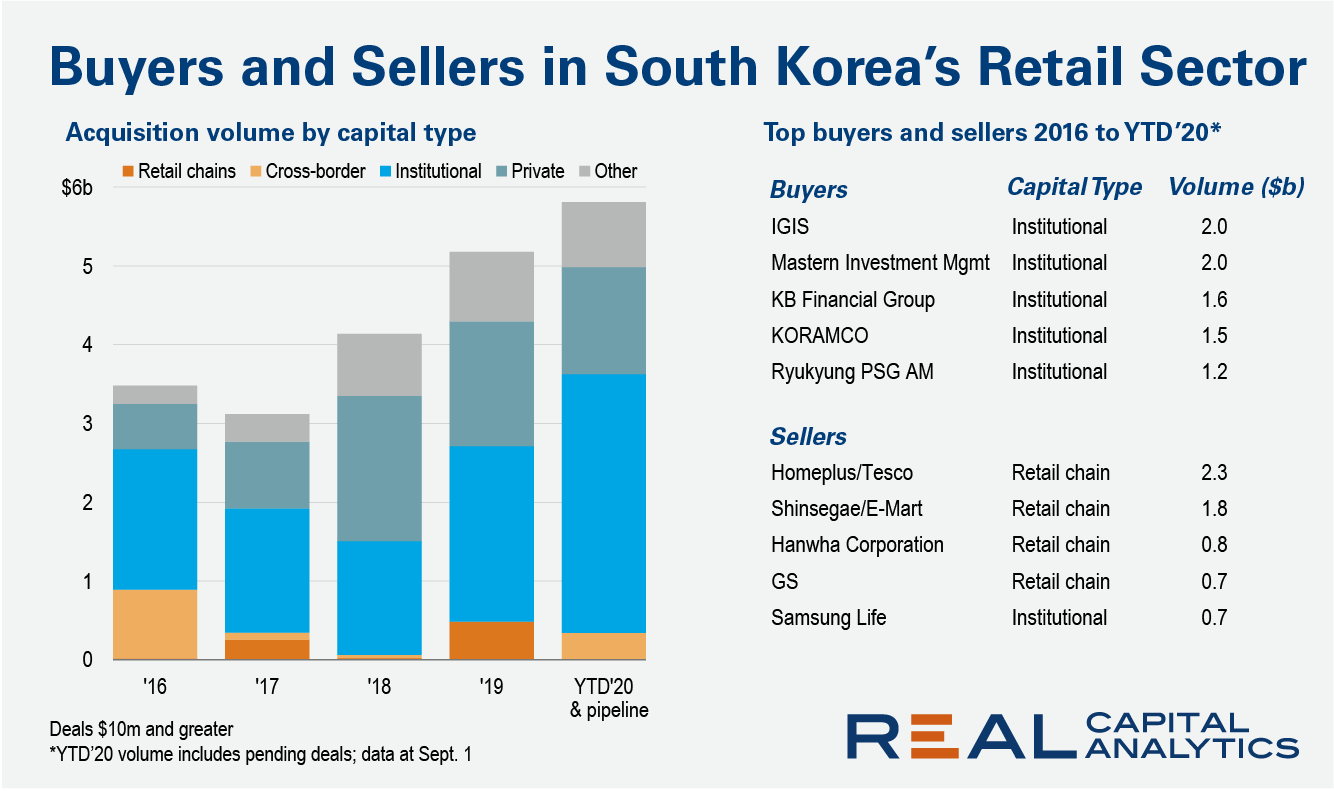
Over the first seven months of 2020, trading of retail assets has crumbled by more than half across all the major Asia Pacific economies bar one – South Korea. Should the current pipeline of deals close by year end, Korea’s 2020 retail investment total will surpass last year’s tally and could potentially become Asia Pacific’s biggest retail investment market, breaking the lock on the top three spots typically held by China, Japan and Australia.
The COVID-19 pandemic put tremendous pressure on the new mortgage market in the United States through May 2020. While COVID-19 has made the in-person home inspection process more challenging, it has not slowed the pace of new mortgage applications and re-financing through this time period.
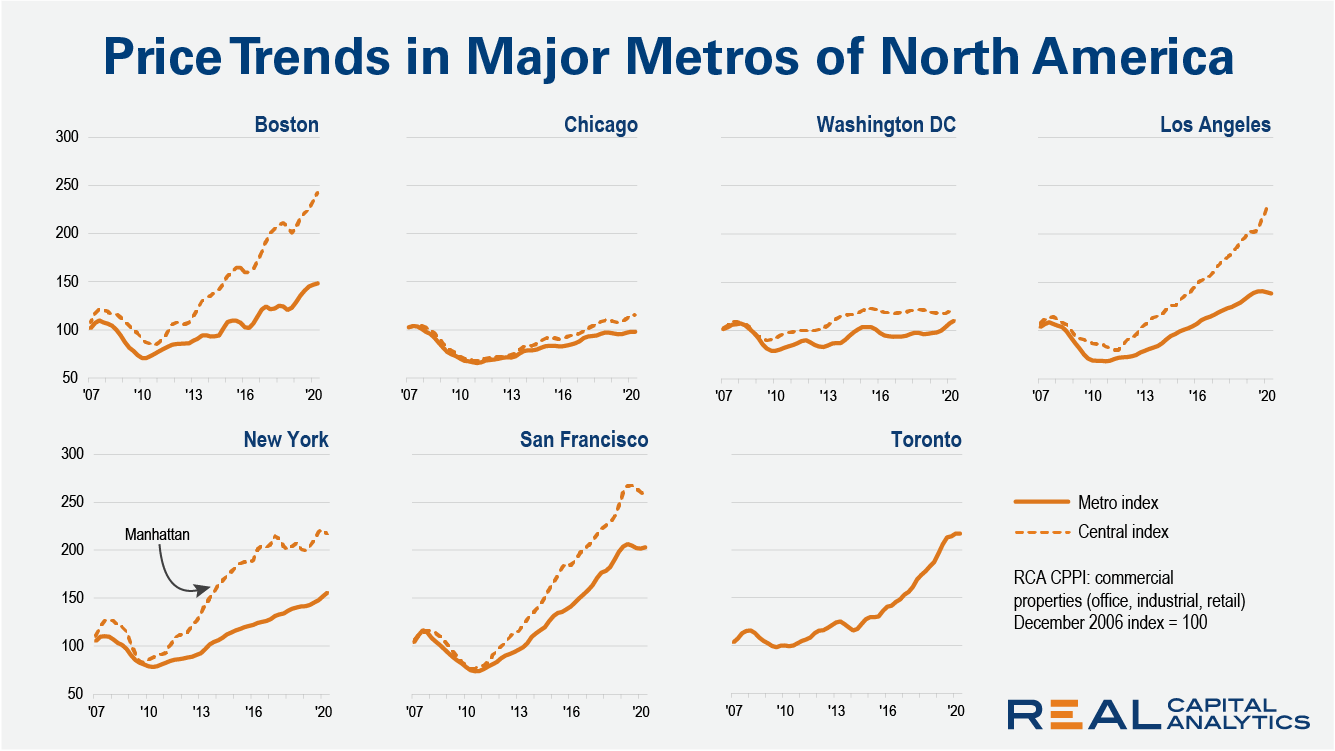
Despite historic challenges to commercial real estate deal activity in 2020, prices in most leading North American metros continued to move higher in the second quarter of the year, according to the latest RCA CPPI Global Cities report. New York metro area prices, which have lagged Manhattan price gains over the past decade, increased 9.0% from a year prior.