Following the temporary housing market freeze during April’s nation-wide shutdowns, national sales of homes during the summer outpaced last year’s levels with September sales averaging 10% higher compared to last September. And according to the latest home buying contracts signed, also known as Pending Sales, the positive trend is expected to continue in the autumn.
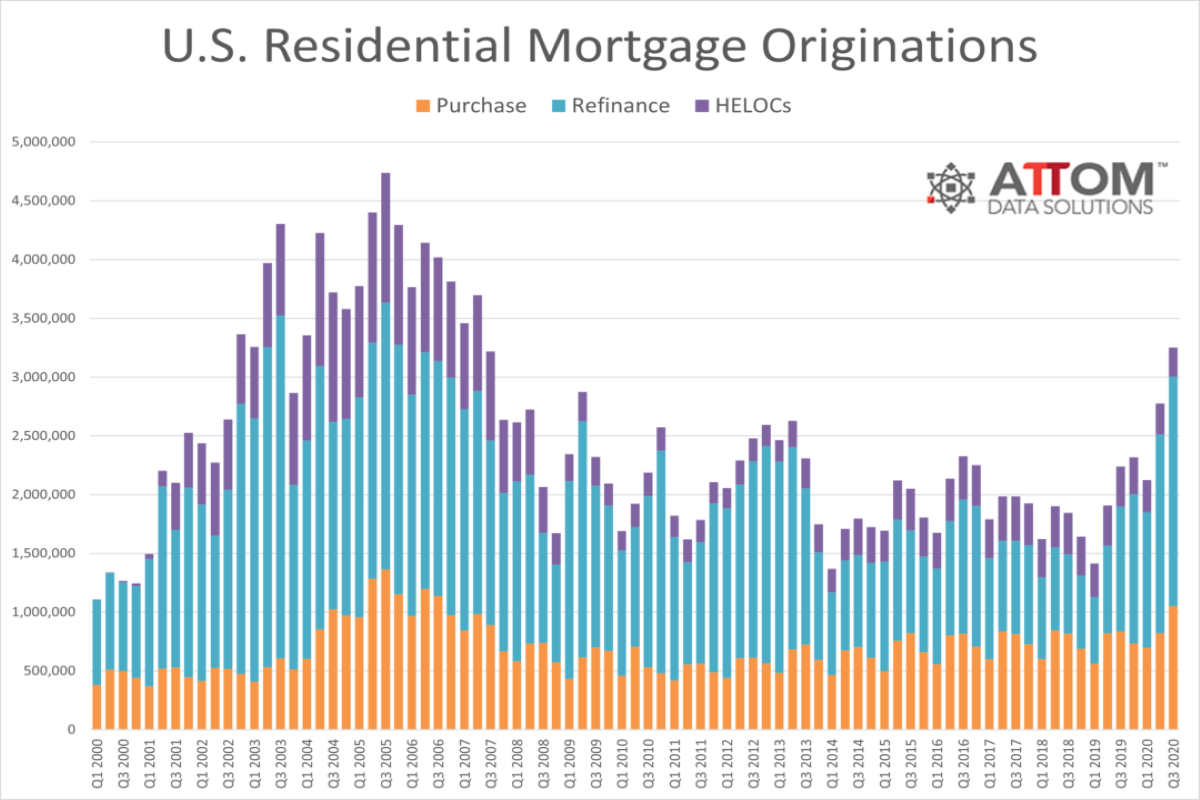
Lending Shoots Up Another 17 Percent in Third Quarter of 2020 As U.S. Braces for More Impacts from Coronavirus Pandemic; Dollar Amount of Home-Purchase Loans Spikes 35 Percent Over Second Quarter; Down payments and Mortgage Amounts Rise To New Highs in Third Quarter
U.S. single-family rent growth strengthened in September, increasing 2.5% year over year, showing solid improvement from the low of 1.4% reported for June 2020, but a slowdown from the 3% rate recorded for September 2019, according to the CoreLogic Single-Family Rent Index (SFRI).
It has been a few months since we’ve checked in on the new construction pipeline. In August’s newsletter the focus was on the larger markets around the country for the most part. In this space today, we take a closer look at the new construction activity in some of the smaller markets.
Class A properties have been especially impacted in a year in which apartment demand cratered thanks to a global pandemic during what is normally a strong portion of the year for the multifamily industry. This was in part due to the influx of new units from the new construction pipeline and in part from a move toward affordability on the part of residents this year.
In August 2020, 6.6% of home mortgages were in some stage of delinquency (30 days or more past due, including those in foreclosure)\[1\], unchanged from July 2020, but a 2.9-percentage point increase from August 2019, according to the latest CoreLogic Loan Performance Insights Report.
Recent loan performance data from CoreLogic shows that the nation’s overall mortgage delinquency rate – the proportion of mortgage loans falling 30 or more days behind scheduled payment, including loans in foreclosure – have risen quickly during the COVID-19 pandemic, as millions of Americans lost their jobs and income due to the economic shutdown.
ATTOM Data Solutions’ just released Q3 2020 U.S. Home Equity and Underwater Report reveals that 16.7 million residential properties in the U.S. were considered equity-rich in the third quarter of 2020, while just 3.5 million mortgaged homes were considered seriously underwater.
Unlike the Great Recession, the speedy intervention provided by the CARES Act ensured mortgage forbearance options for homeowners who were financially harmed by the pandemic recession and had a federally backed loan. And while forbearance options will help some homeowners keep their homes, the path of employment rebound – which is still unclear - will be a critical determinant for many delinquency outcomes.
Equity-Rich Properties Now Outnumber Those Seriously Underwater by Almost Five-to-One Margin; Portion of U.S. Homes Considered Equity-Rich Grows to 28 Percent; Share of Seriously Underwater Properties Stay at 6 Percent
The COVID-19 pandemic has had a big effect on the mortgage market. Along with a drop in mortgage rates to a record low, the jumbo-conforming mortgage rate spread has also been affected. Before 2013 mortgage rates for jumbo loans were higher than for conforming loans. However, in 2013 the rate-difference fell, and jumbo rates have averaged 5 basis points lower than conforming during 2013-2019.
National home prices increased 6.7% year over year in September 2020, according to the latest CoreLogic Home Price Index (HPI®) Report. The September 2020 HPI gain was up from the September 2019 gain of 3.5% and was the highest year-over-year gain since May 2014.
Once again, no news may be good news for the US housing sector. There are positive forces, such as interest rates for mortgages at or near record lows, and a potential trend of buyers moving away from urban areas amongst other factors that may buoy demand for housing and support construction. Similar trends are occurring in the UK housing market, where mortgage demand is red hot.
Why settle for a deal when you can hold out for a steal? That is the attitude of investors hoping to cash in on distressed asset sales in the aftermath of the Covid-19 downturn. The reality, however, is that many of the highest quality assets will not be available on the cheap.
Welcome to the November 2020 National Apartment List Rent Report. With the peak summer renting season behind us, we are now entering the time of year when fewer moves normally take place, causing a seasonal dip in rent prices. And although this year’s peak season was significantly disrupted due to the COVID-19 pandemic, our national index has stabilized back to a more typical trend over the past few months.
Number of Zombie Foreclosures Drops 4 percent From Last Quarter; Percentage of Foreclosure Properties Sitting Empty Stays About the Same; Among All Residential Properties, Zombie Foreclosures Represent Just One of Every 13,100
The forgone spring home-buying season appears to have fully shifted into summer months, leading to sales volumes that are picking up speed at a time when they would normally show signs of slowing. Not only was demand in August fueled by buyers planning on purchasing a home in the spring, but also by those motivated by record-low mortgage rates, desire for a larger home or desire for a vacation home as a result of the pandemic.
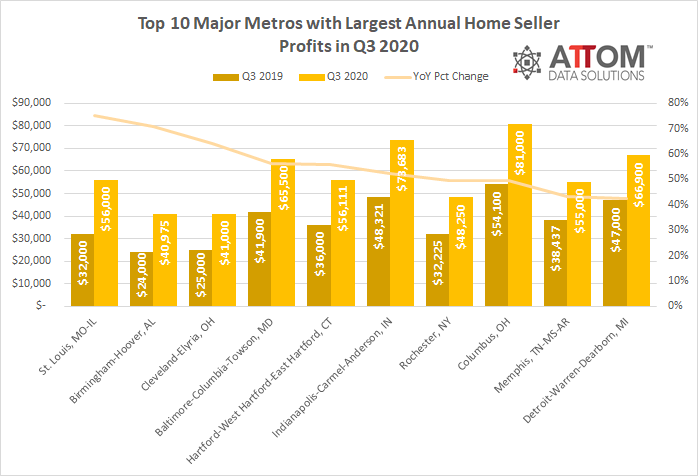
ATTOM Data Solutions’ just released Q3 2020 U.S. Home Sales Report reveals that both the raw-profit and return-on-investment figures recorded from the typical home sale in the U.S. in third quarter of 2020, stand at the highest points since the U.S. economy began recovering from the Great Recession in 2012.
Loan application volume, mortgage rates, and lenders underwriting standards have been impacted by the COVID-19 pandemic. For example, the mortgage interest rate is at a record low and purchase loan application trend highlights strong demand for home buying. Lenders may have changed their underwriting standards in response to these trends and economic uncertainty.
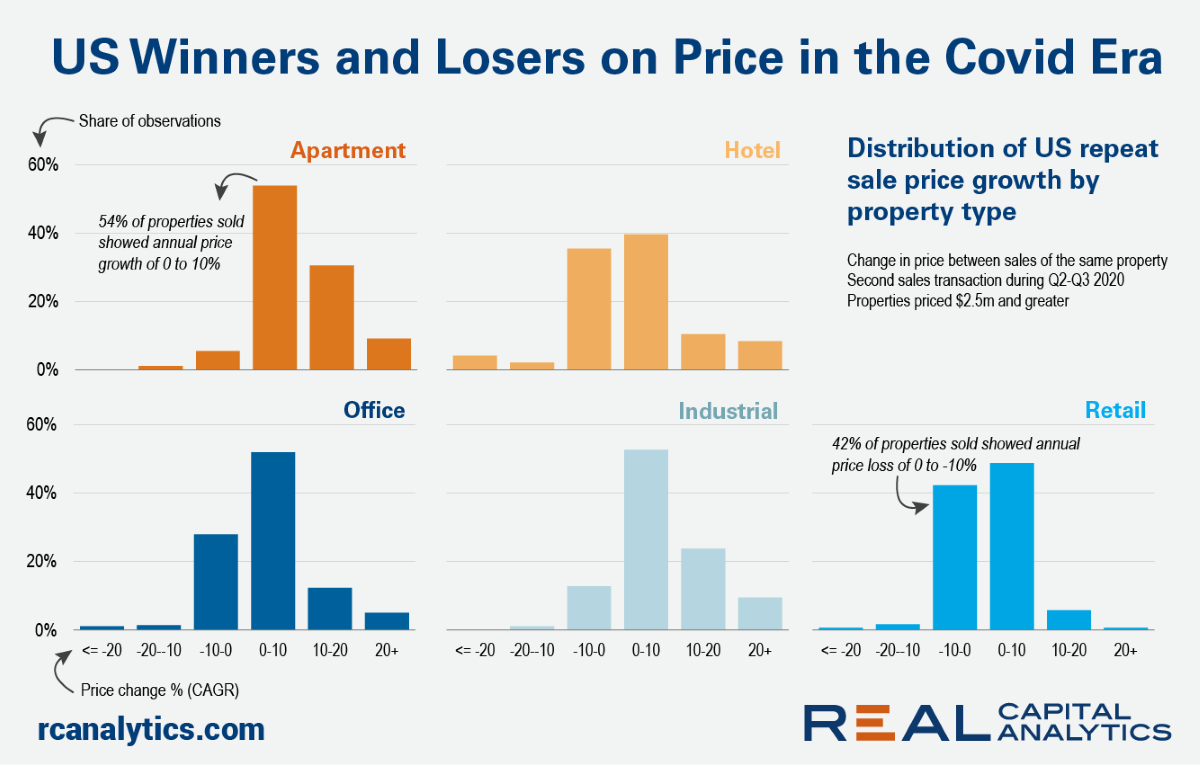
The annual rate of U.S. commercial real estate price growth came in at 1.4% in September, as continued gains in apartment and industrial sector prices balanced out declines in retail and office prices, the latest RCA CPPI: US summary report shows. The US National All-Property Index gained 0.2% in September from August.


