As the coronavirus continues to affect nearly every city in the U.S., many are struggling to envision what the road to recovery may look like. Moody’s Analytics sought to provide clarity for that vision in a recent report. They examined the top 100 metro areas in the U.S. to identify the 10 cities best positioned to recover from the coronavirus, as well as the 10 worst. We then took a look at the cities Moody’s highlighted to understand if our jobs data could add additional insights on prospects for economic recovery.
Equity-Rich Properties Continue to Outnumber Those Seriously Underwater by Four-to-One Margin; Portion of U.S. Homes Considered Equity-Rich Ticks Up to 27.5 Percent; Seriously Underwater Properties Down to 6 Percent. 15.2 million residential properties in the United States were considered equity-rich, meaning that the combined estimated amount of loans secured by those properties was 50 percent or less of their estimated market value.
National home prices increased 4.9% year over year in June 2020, according to the latest CoreLogic Home Price Index (HPI®) Report. The June 2020 HPI gain was up from the June 2019 gain of 3.5%. Strong demand, especially by younger home buyers, and low supply helped push home prices higher in June.
2020 has been a bumpy ride for the multifamily industry, especially the second quarter. Although the impact of COVID-19 and the new economic environment has been felt across the board, there are some distinct differences in how that has played out on the ground. One angle from which some differences become apparent is from the perspective of price class.
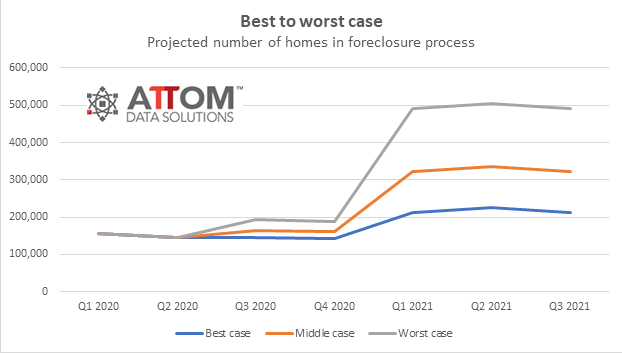
The United States faces a possible foreclosure surge over the coming months that could more than double the number of households threatened with eviction for not paying their mortgages – an offshoot of the worldwide Coronavirus pandemic that has cast a shadow over the nation’s eight-year housing market boom.
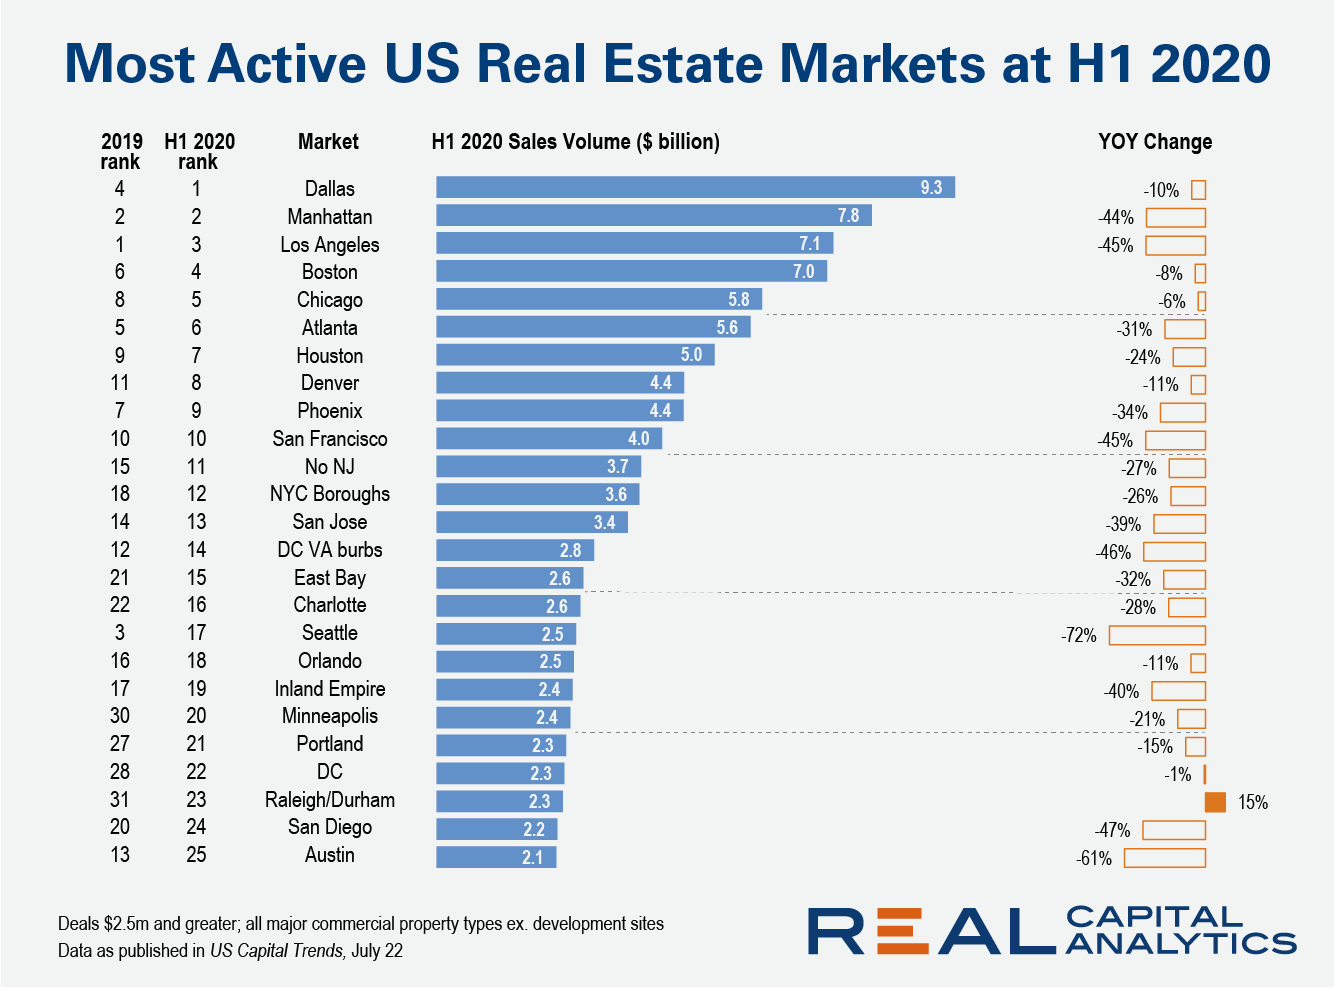
For the first time ever, Dallas ranked as the #1 U.S. commercial property market at the halfway mark of the year, despite a dip in investment activity. Dallas overtook Manhattan and Los Angeles, where sales activity fell by more than 40% compared to the first six months of 2019 as the Covid-19 crisis scuttled dealmaking and sidelined investors.
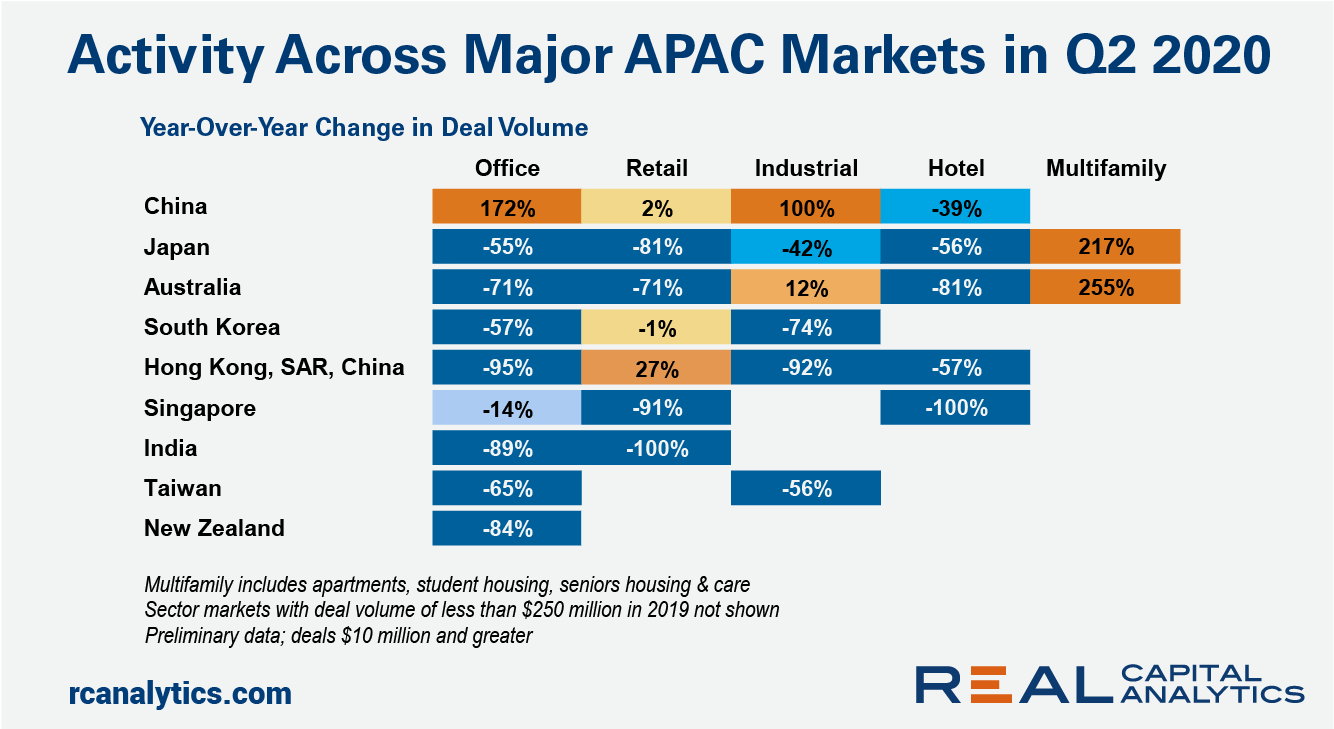
China’s commercial real estate market rebounded in the second quarter of 2020, while the worsening economic outlook took its toll on investment sentiment across the majority of sector-markets in the region. The demand for Chinese office skyscrapers leaped, with nine buildings priced over $250 million changing hands in the quarter.
It has become clear that the effects of the pandemic are far from behind us, and the economy does not appear on track for the quick V-shaped recovery that many had originally hoped for. While this economic weakness continues to be reflected in sluggish rent growth, our national rent index actually inched up slightly by 0.1 percent over the past month, the first monthly increase since the start of the pandemic. That said, year-over-year growth still stands at just 0.2 percent nationally, and many markets are continuing to see notable declines in prices.
Home sellers nationwide realized a gain of $75,971 on the typical sale, up from the $66,500 in the first quarter of 2020 and from $65,250 in the second quarter of last year. The latest figure, based on median purchase and resale prices, marked yet another peak level of raw profits in the United States since the housing market began recovering from the Great Recession in 2012.
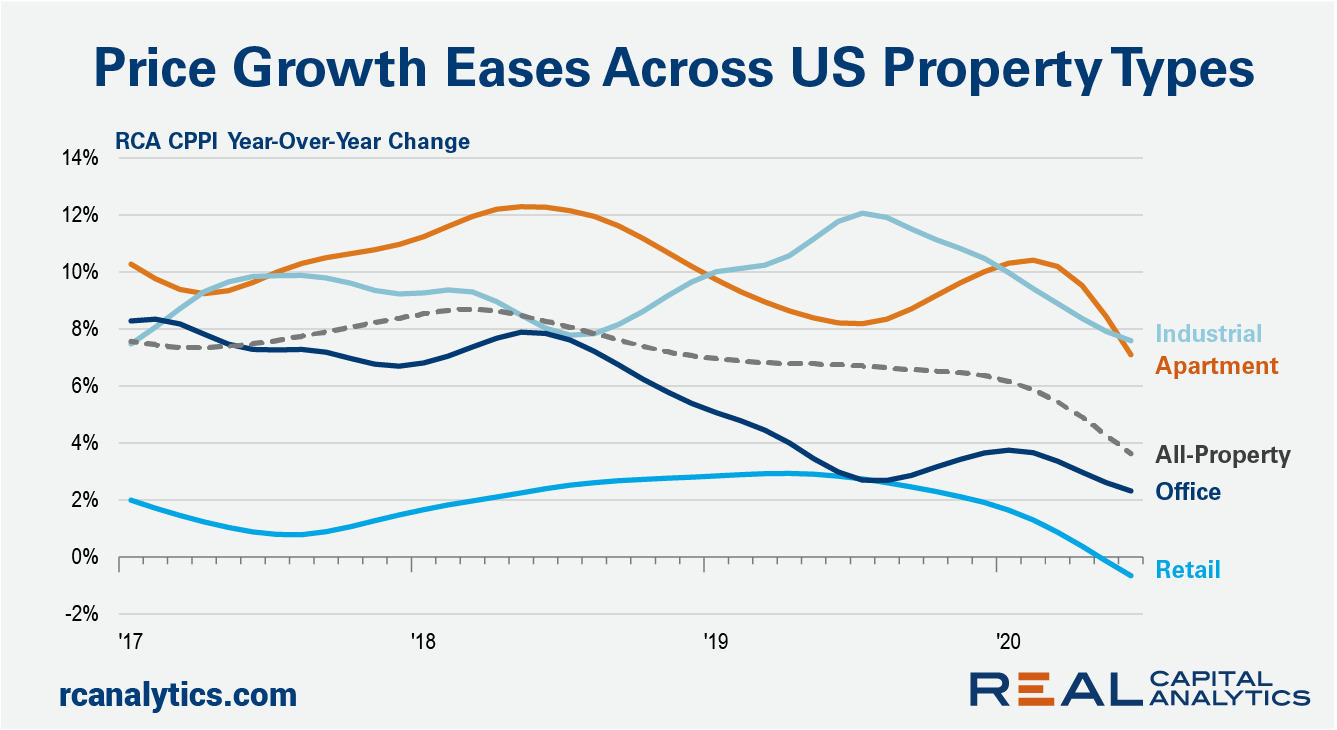
Commercial property price growth slowed in June across all U.S. property types, dragged down by the continued impact of the health and economic crisis. The US National All-Property Index was flat in June from May and gained just 3.6% year-over-year, the latest RCA CPPI summary report shows. Retail prices fared the worst of the sectors, dipping 0.3% from May and down 0.7% over the past year.
The COVID-19 pandemic and resulting recession have wreaked havoc on U.S. building markets. According to Dodge Data & Analytics, commercial and multifamily starts were quite healthy during January and February but stalled as the pandemic hit the nation in March. For the first three months of 2020, U.S. multifamily and commercial building starts inched up 1% from the same period of 2019.
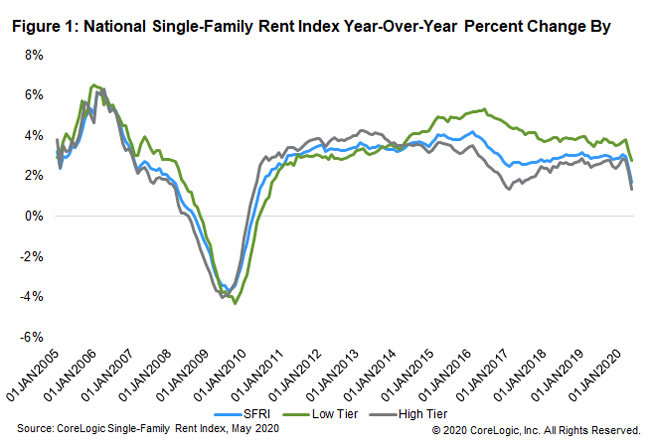
U.S. single-family rents increased 1.7% year over year in May 2020, a sharp slowdown from the prior month, and the lowest growth rate since July 2010, according to the CoreLogic Single-Family Rent Index (SFRI). The index measures rent changes among single-family rental homes, including condominiums, using a repeat-rent analysis to measure the same rental properties over time.
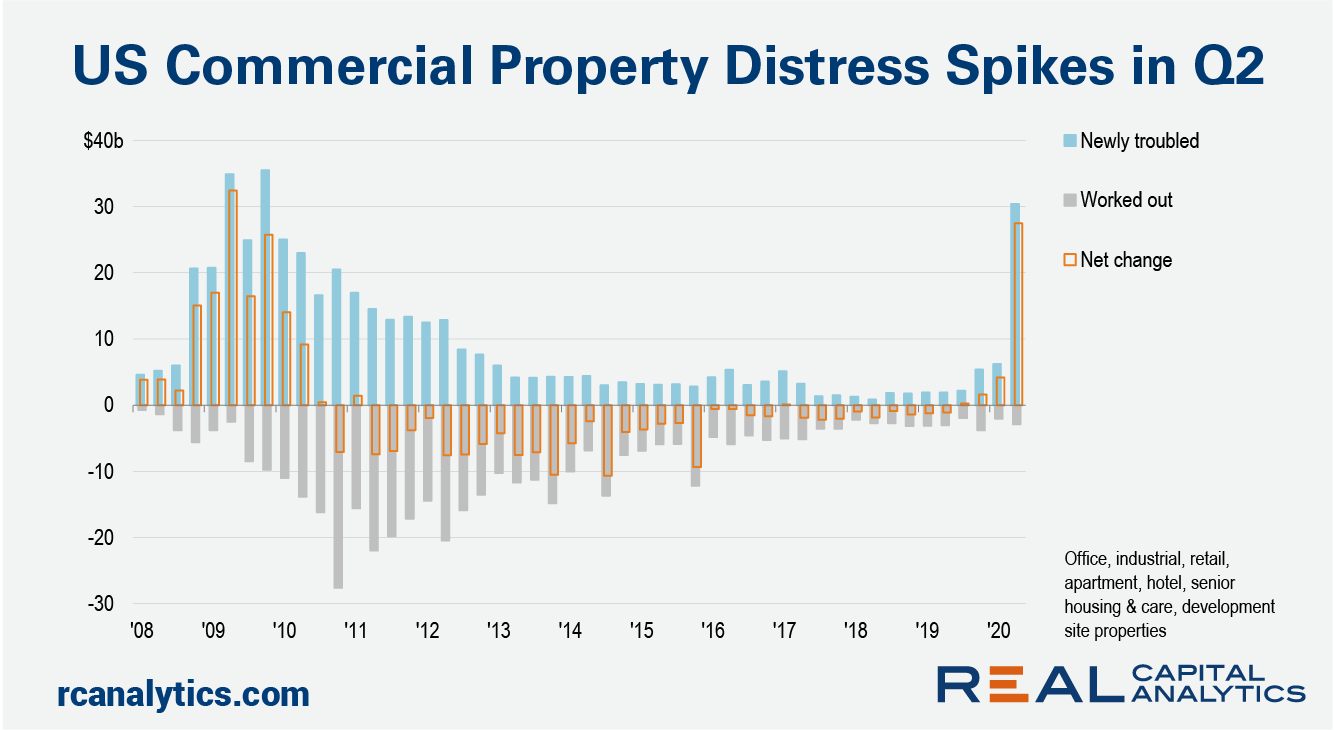
U.S. commercial real estate transaction activity during the coronavirus-blighted second quarter was far from the worst on record. However, the magnitude of the drop from the first quarter was unprecedented. Evidence of distress is mounting, according to Real Capital Analytics data, though it’s clear that the pain from the Covid-19 crisis has not been experienced equally across all the property types.
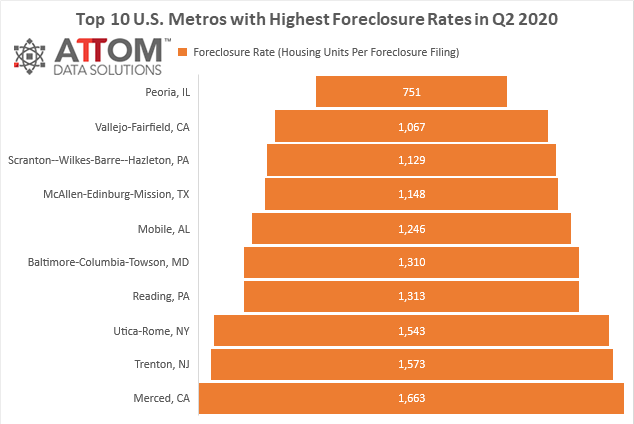
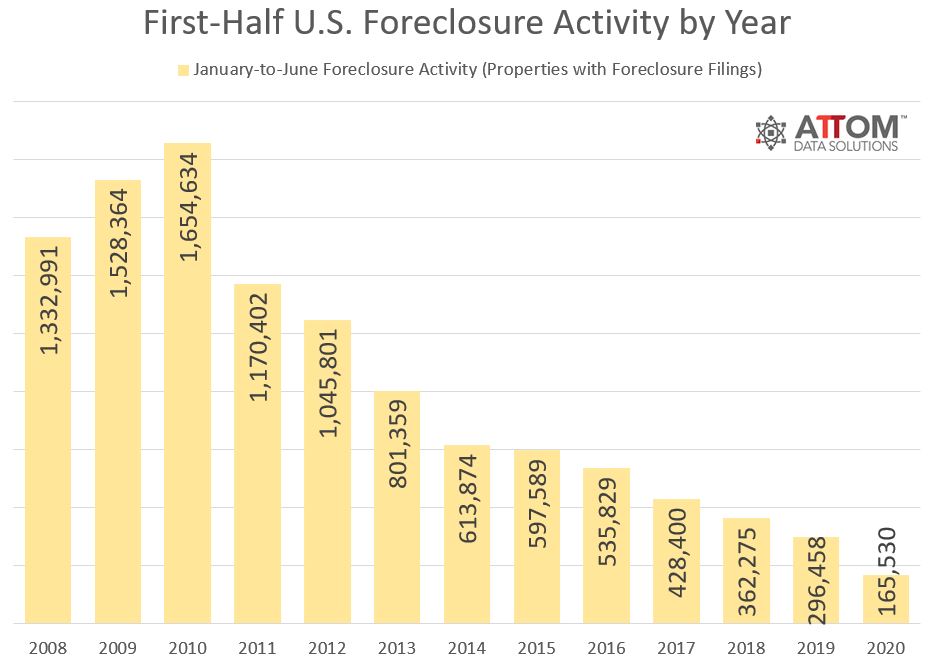
According to ATTOM Data Solutions’ recently released Midyear 2020 U.S. Foreclosure Market Report, U.S. properties with foreclosure filings — default notices, scheduled auctions or bank repossessions — in the first six months of 2020, hit an all-time low with 165,530 filings reported. Nationwide 0.12 percent of all housing units (a foreclosure rate of one in every 824 housing units) had a foreclosure filing in the first half of 2020.
While the coronavirus’s short-term impact on the housing market has already started to materialize in the form of softening rents, the long-term implications for the urban landscape are still far from certain and being hotly debated. One of the biggest outstanding questions is the degree to which COVID will shift preferences away from cities. Over the past several months, many consider the close quarters associated with urban density to be a liability, and many of the local amenities that city-dwellers love are shut down in compliance with social distancing requirements.
There were a total of 165,530 U.S. properties with foreclosure filings — default notices, scheduled auctions or bank repossessions — in the first six months of 2020, down 44 percent from the same time period a year ago and down 54 percent from the same time period two years ago.
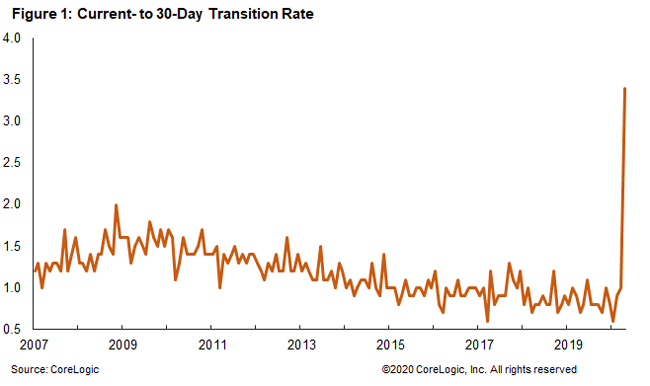
In April 2020, 6.1% of home mortgages were in some stage of delinquency (30 days or more past due, including those in foreclosure), the highest overall delinquency rate since January 2016, according to the latest CoreLogic Loan Performance Insights Report. The April 2020 overall delinquency rate jumped 2.5 percentage points from the prior month as the impact of the coronavirus pandemic and resulting recession made it difficult for borrowers to make their monthly mortgage payments.
COVID-19 has caused commercial real estate leasing activity to fall to historically low levels. Leasing activity usually tends to be resilient in downturns, for the simple reason that leases expire, and tenants have to make decisions about their space. Social distancing and working at home have made coordinating a new lease all the more difficult.
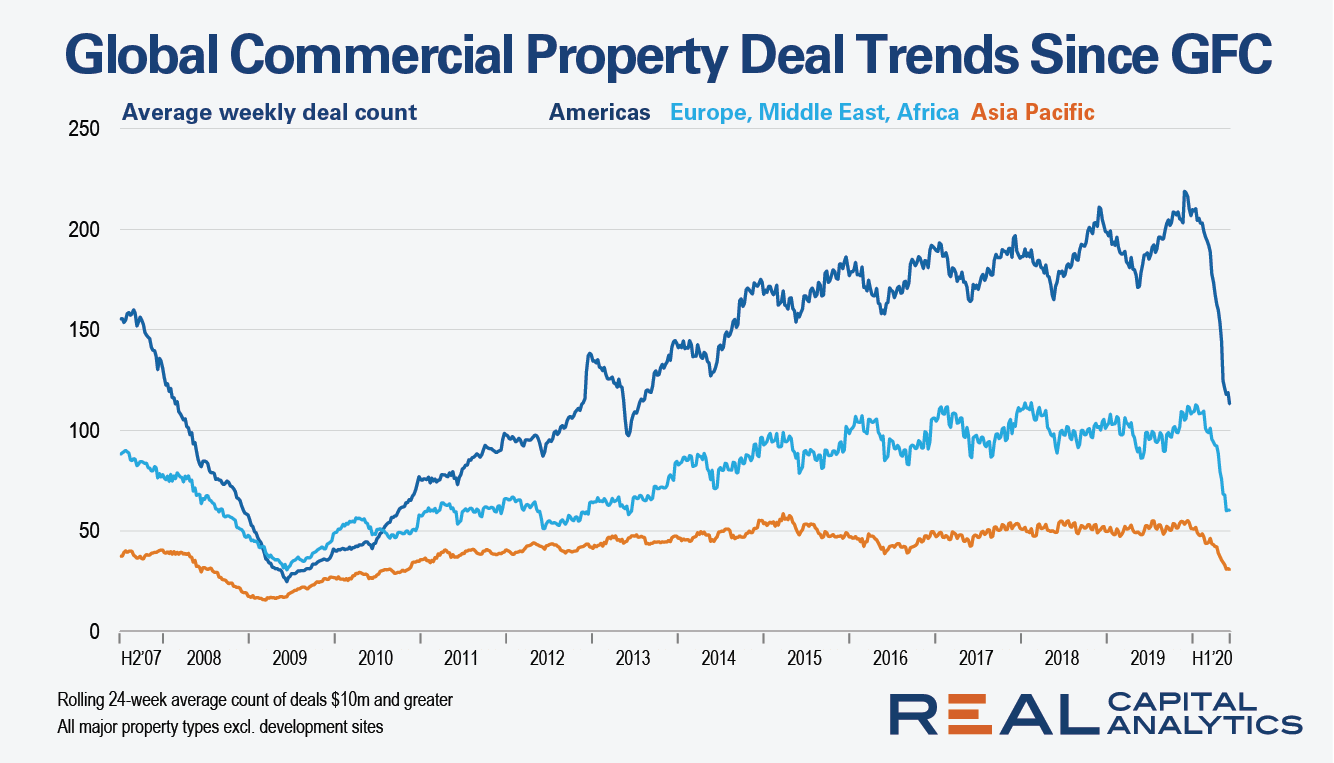
Prior to the Global Financial Crisis, the number of deals completed in a typical week was above 150 in the Americas, a little under 100 for Europe, Middle East, Africa (EMEA) and around 40 in Asia Pacific (APAC). Commercial real estate activity in both EMEA and the Americas slid to a low point in the middle of 2009. APAC had already trickled to just a handful of weekly deals at the start of 2009, staying at a low ebb for six months.
The newly released CoreLogic HPI for May shows that home prices held up very well in the United States. However, most of the home prices captured in the May report were from transactions negotiated in April or March since it takes on average 30 to 45 days to settle a transaction. Many states have entered different reopening phases since the beginning of May, and as a result housing market activity has increased.


