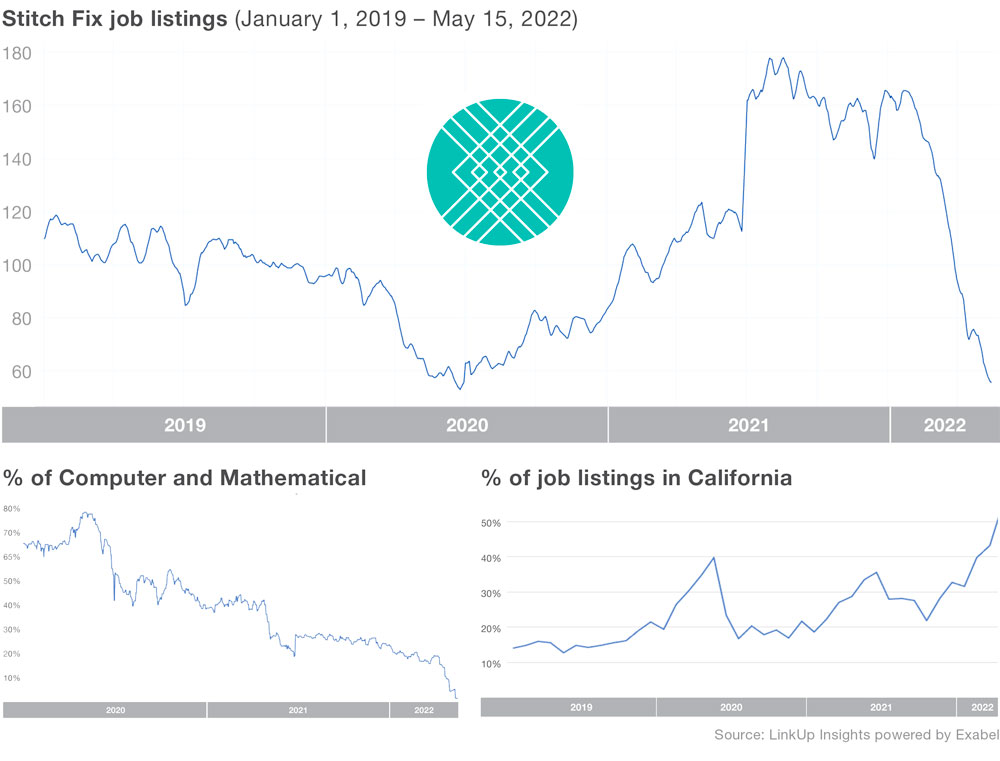
A recession is starting to look like a possibility. Household budgets are being squeezed by decades of rising inflation, housing costs are continually breaking records, and consumer confidence is plummeting. As a result, customers are less likely to spend money on non-essential things. The apparel industry bears the brunt of the impact. Consumers can easily trade down for less expensive items and stretch out the lifespan of their existing wardrobe. It’s easy to slash spending on apparel when times are tough.
Stranger Things 4 and Obi-Wan Kenobi launched Friday at midnight on Netflix and Disney+, respectively. By Sunday of the holiday weekend in the U.S., mobile downloads increased 38% from Friday for both streaming competitors. Each also achieved the highest daily downloads for the month of May after a six-week slump. Since Netflix’s first report of significant churn at its Q1 earnings, more attention has turned to Netflix performance relative to its competitors.
Welcome to the June 2022 Apartment List National Rent Report. Rent growth accelerated slightly again this month, with our national index up by 1.2 percent over the course of May. So far this year, rents are growing more slowly than they did in 2021, but faster than the growth we observed in the years immediately preceding the pandemic. Over the first five months of 2022, rents have increased by a total of 3.9 percent, compared to an increase of 6.1 percent over the same months of 2021.
In this Placer Bytes, we dive into two brands in the gaming and entertainment space – GameStop and Dave & Buster’s. Like most other businesses that rely on crowds congregating indoors, Dave & Buster’s took a hit over COVID. But foot traffic began picking already in July 2021, and recent data shows that the brand’s growth streak is continuing in 2022. Year-over-year (YoY) visits have increased dramatically since the height of the pandemic, and year-over-three-year (Yo3Y) foot traffic has exceeded pre-pandemic levels for the past three months.
Southeast Asia’s ride-hailing market keeps evolving as more players join and as users’ behavior shifts. As most of the Southeast Asian countries reopen, the ride-hailing market has gradually grown back to normal pre-covid figures. In Thailand, Bolt and Grab are the two major ride-hailing apps still in the game after Gojek sold its Thai business to Airasia last year. At Measurable AI, we build and own a unique consumer panel and are the largest transactional email receipt data provider for the emerging markets. We are well regarded for our comprehensive dataset across the digital economy including the ride-hailing industry.
Advertisers are back buying video ads—where are these ad dollars going and what does it tell us about the future of video advertising? MediaRadar is here with the answers. No surprise here, but people like watching videos. So much so that the average person spends more than 2 hours a day watching them. Some estimates predict that time spent watching videos will start to plateau or decline—not because video’s becoming less popular, but because there’s only so much time in the day. However, the popularity of OTT, mobile and YouTube will keep videos around forever.
By this point, we know that COVID-19 can cause almost any symptom under the sun, from cough to fatigue to stomachache. Since COVID-19 symptoms often appear similar to those of the common cold, flu, and other contagious illnesses, a test is necessary to confirm diagnosis. However, **there is one symptom that is fairly unique to COVID: the loss of taste or smell**.
With Memorial Day Weekend beginning tomorrow in the US and clear skies ahead for summer travel in the US and UK, we take the opportunity to look at how travel has changed over the past few years. In today’s Insight Flash, we compare how the different subindustries have fared, and dig into whether ABNB has been able to continue to ride the tide of changing travel habits. The year-over-year growth for Travel in the UK has been much stronger than in the US, with all of the major subindustries more than doubling the number of transactions seen in calendar 2022Q1.
The last few months have seen a much-welcomed boost in demand for the travel industry as COVID-19 restrictions have continued to ease in many parts of the world. STR’s Market Recovery Monitor shows that around two-thirds of global markets and over 95% of U.S. markets are now in a recovery or peak position achieving revenue per available room (RevPAR) indexed to 2019 at 80 or above. Further, around 70% of U.S. markets and 40% of global markets are now achieving higher RevPAR than in pre-pandemic times.
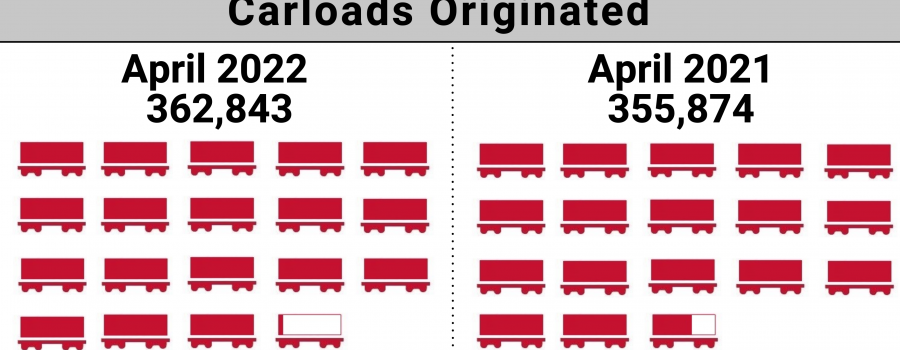
The number of carloads moved on short line and regional railroads in April 2022 was up compared to April 2021. Carloads originated increased 1.7 percent, from 355,874 in April 2021 to 361,793 in April 2022. Metals and Products led gains with a 17.3 percent increase. Petroleum Products was up 16 percent, and Nonmetallic Minerals and Food and Kindred Products increased 12 and 11.5 percent respectively.
As inflation and gas prices remain high, foot traffic to dollar, discount, and thrift stores is booming. We dove into visits to Dollar General, Family Dollar, Five Below, and Goodwill to find out more about these high-performing retailers. Inflation hasn’t spared dollar stores, with a recent analysis of various discount brands finding that prices at leading chains increased for several basic products. But since prices have also increased across retail categories throughout the western world, discount retailers are still remaining comparatively cheaper and giving value-driven customers a reason to visit their stores.
Global downloads of the top 10 ultra fast delivery apps have grown 127%, year-over-year in Q1. With a more granular, monthly breakdown we can see a lot of this growth taking place in Q4 of 2021. As you can see in the chart below, this is a faster growth rate than that of the top 10 meal delivery apps (ex: Uber Eats) or top 10 grocery delivery apps (ex: Instacart). Meal delivery still takes the cake when it comes to absolute numbers.
College graduation season is here. But starting your career can be tricky. There are the coveted big corporate jobs, which can provide structure and stability, and then there are the new dynamic startups, which can provide fast growth. Does starting at a fast-growing startup put you at an advantage for your career? First, when we compare the salary growth of people who started their careers at fast-growing startups with that of slower-growing startups, we find that while they were initially paid less, their salaries overtook their peers after just three years, and continued to grow at a faster pace thereafter.
In the retail space, the divide between outdoor-focused brands and sporting goods retailers is becoming increasingly blurred. But no one has done more to integrate all manners of recreational gear under one company than Dick’s Sporting Goods. The retailer operates several specialized brands to cater to customers looking for equipment to support a diverse range of activities, from golf to fishing to team sports to yoga. To better understand this sector, we took a closer look at the wider ecosystem of Dick’s Sporting Goods.
Since TikTok introduced TikTok for Business, advertisers have been investing massively in the platform that has quickly become a household favorite among Gen Z users. Pathmatics now tracks and breaks out TikTok insights, which reveals that U.S. advertisers spent an average of $338 million per month on the platform—and more than $400 million in April alone. In our latest report, The State of TikTok Advertising in the U.S., we analyze how the top U.S.-based advertisers are spending and crafting their messaging on TikTok.
In 1946, studio executive Darryl F. Zanuck said, “Television won’t be able to hold on to any market it captures after the first six months…People will soon get tired of staring at a plywood box every night.” Boy, was he wrong. If anything, the reason people get tired these days is because they’ve been starting at the “plywood box” too much. To say TV and related technology, like OTT (or “over-the-top”/streaming services) is popular would be an understatement. This year, 1.88b people will use OTT services like Netflix, Peacock, Discovery+ and Paramount+.
Used cars stand out among the many categories seeing unprecedented demand recently, with many cars being sold even before they hit dealer websites. In today’s Insight Flash, we focus in on trends for CVNA and KMX, two of our most strongly correlated auto names, looking at inventory growth, average value of inventory versus units sold, and trends in model year sales.
The r/wallstreetbets and "meme stock" news cycle in late January 2021 was a coming out party for retail investing and the apps that enable it. When Robinhood hit #1 Overall in the U.S. iOS App Store on January 27, 2021, it was the first time a retail trading app had done so. Apptopia's latest report, Trendlines in Retail Investing Apps, looks at the impact and how competitors have faired since then.
It has been a disappointing week for global airline capacity as total seats once again falls back below ninety million with China reporting a further 25% reduction in capacity week on week. At 8.6 million seats, China is at one of its lowest capacity points since January 2020 and in the short term any significant improvement is unlikely given current lockdowns. Notwithstanding the issues in China, global capacity looks to be holding steady. Through to the end of August a further 12 million seats have been dropped by airlines around the globe of which 7 million are over the next ten days and of the 7 million virtually all are in China.
For the four-week period ending 14 May 2022, more than three-quarters of all U.S. hotel markets outperformed their comparable 2019 revenue per available room (RevPAR) on a nominal basis. Of 165 STR-defined U.S. markets, only 38 fell short of their 2019 RevPAR, which was a solid improvement from 52 underperformers in April’s “bubble” blog update. Industry RevPAR looks to be on steady footing; however, a look at RevPAR contribution shows a greater influence from average daily rate (ADR) as opposed to occupancy in many areas.


