In the wake of an earnings miss in its most recent fiscal quarter, Bed Bath & Beyond Inc (NASDAQ: BBBY) recently announced leadership changes and is reportedly considering a sale of its Buybuy Baby subsidiary. Consumer transaction data reveals that for BBBY’s namesake retail chain Bed Bath & Beyond, sales in June 2022 were about half of what they were three years ago. In addition, an analysis of sales by purchase channel found that in-store shopping continues to dominate Bed Bath & Beyond’s sales, but ecommerce customers have a higher average monthly spend at the home goods retailer.
Our latest white paper dives into the biggest retail, dining, and fitness trends of the first half (H1) of 2022. The data indicates that while H1 2022 took brick-and-mortar businesses – and the economy as a whole – on a wild ride, the extent of the challenges may be overblown. And while some categories will bear more of the brunt of the current economic downturn than others, the situation is also creating opportunities for brands who can cater to customers’ current value orientation.
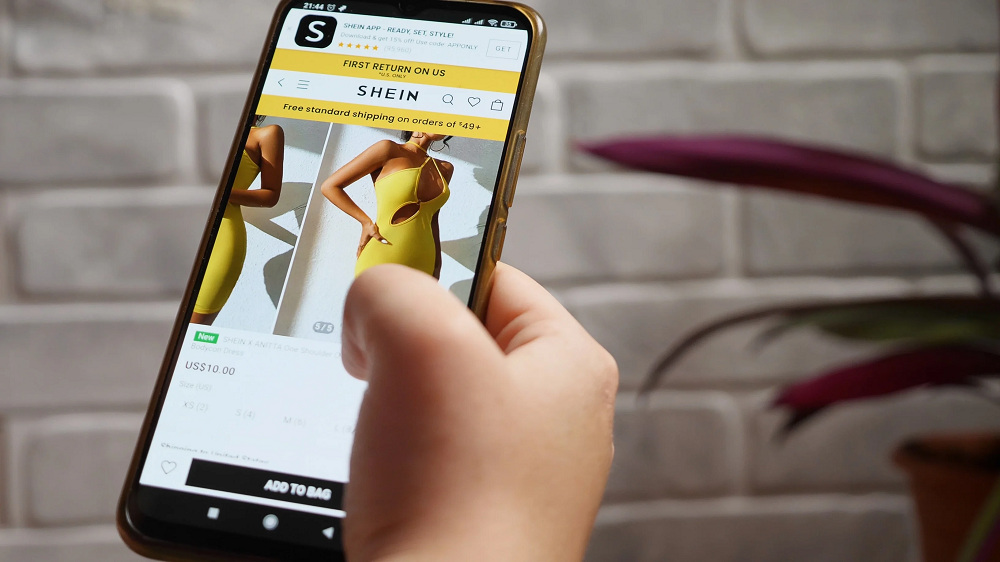
Meesho and Shopee are the two most downloaded shopping apps in the world at the halfway mark in 2022. Each have so many downloads that they appear in our Most Downloaded Apps in H1 2022 Worldwide chart, which is a first for shopping apps in the three years that Apptopia has done annual rankings. Shopee ranked first in 2021, but Meesho has been on a fast clip. Over the last 18 months, downloads grew 1400% from the full year 2020.
PayPal is still dominating the global payments scene, with close to 50 million downloads in the first half of 2022. PhonePe, which is not far behind PayPal, is a bit of a Super app. Used almost exclusively in India, it enables users to do everything from send friends money, buy ecommerce goods, invest in stocks and more. While super apps are less common in the United States, PayPal and Cash App are both heading that way, continually adding abilities to generate a larger share of the market and access more user data.
For the first time, gas savings and flight tracking apps appear in the 10 Most Downloaded Travel Apps, a sign of the times during this first half of 2022. FlightRadar24 ranks tenth worldwide, and Upside (cash back on gas) is the third most downloaded travel app in the U.S. The other changes in rank since our 2021 download leaders list shows up among ridesharing and online travel agency (OTA) apps.
As companies increasingly rely on social media to engage with customers, they have turned to social media managers to promote their products, design campaigns, and manage branding. This week, we take a look at the rise of the social media manager role and chronicle how the demographics and activities of this profession are evolving. While the title was less common in 2010, the number of individuals whose jobs focus on managing their company’s digital presence has steadily grown – by April 2022, there were over 64,000 social media managers in the United States.
The coffee space outperformed the wider dining sector for much of 2021, but the Omicron surge halted the category’s foot traffic growth, and the recent economic challenges appear to be holding the category back. We dove into visits to Starbucks, Dunkin’, and Dutch Bros., as well as foot traffic to the wider coffee space, to understand how inflation and high gas prices are impacting the coffee sector’s performance.
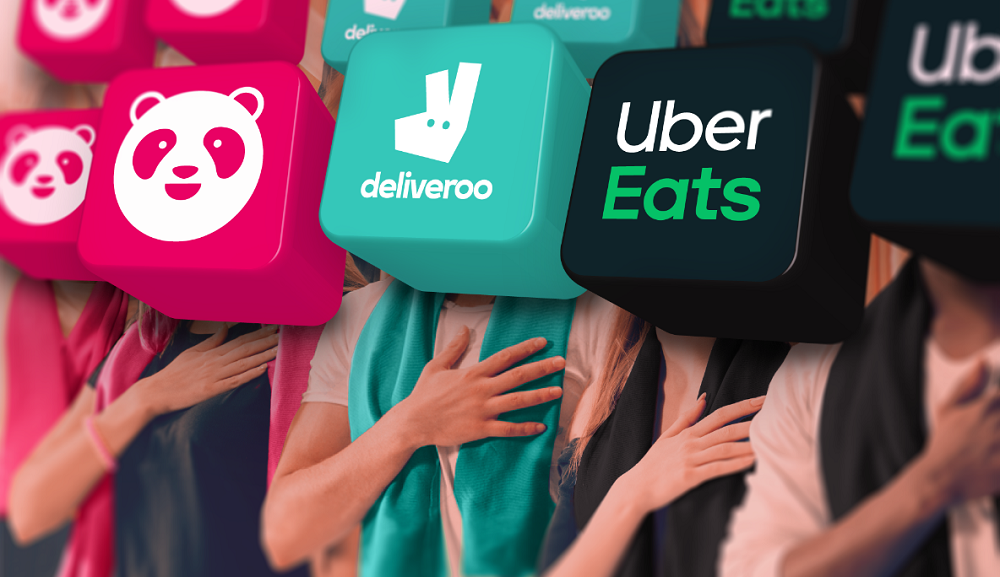
As we endure the third year of Covid-19, most people have adjusted to the ‘new normal’ and returned back to working in the office. While it is not surprising to witness a pull back on purchases relating to remote work, what about food delivery? Looking at Asia alone and digging into Measurable AI’s consumer panel, the data reveals that users are actually becoming more loyal now to the leading food aggregators than ever before.
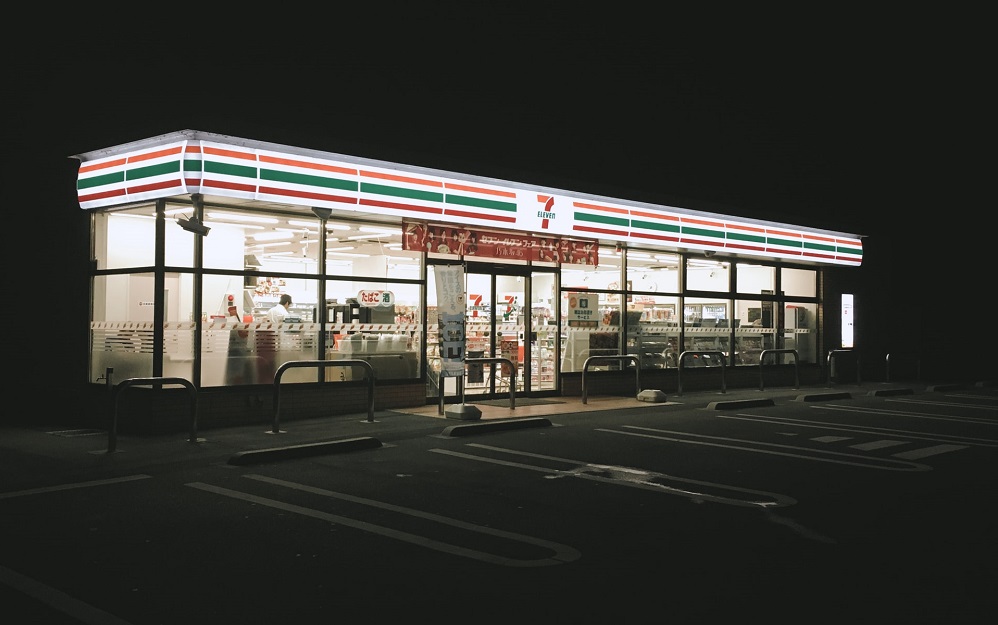
With high gas prices continuing to impact consumer spend, delivery startups gaining market share, and, well, the fact that it’s the eleventh of July, it’s only appropriate to take a deep dive into the world’s largest convenience chain 7-Eleven. In today’s Insight Flash, we take advantage of our ability to separate the company’s fuel versus ex-fuel sales to assess performance versus the overall Convenience subindustry, examine how often its customers cross-shop competitors, and look at how demographics differ between the two sides of the business.
We took a look at office foot traffic trends since the start of the pandemic with a special focus on the first half of 2022 to see what visit patterns could tell us about the workplace recovery. The first half (H1) of 2022 showed strong year-over-year (YoY) growth for office foot traffic. New York City, Chicago, San Francisco, and Boston all showed sustained growth in monthly office visits compared to the equivalent months last year.
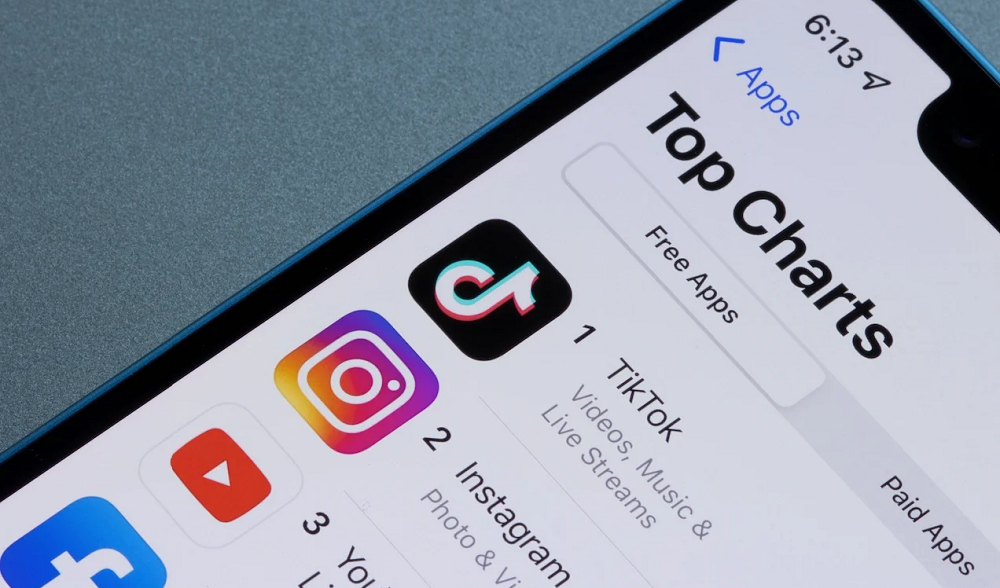
The first half of the year is already over, it always flies by so quick! We're stopping to review the mobile app download leaders for the first half of 2022 (through June 30th). The two lists in this post do not include mobile games. To get a feel for how things are changing, you can review Apptopia's 2021 worldwide and US download leaders before diving into the below. We'll also be releasing H122 top charts for Travel, Retail, Fintech, Entertainment and more.
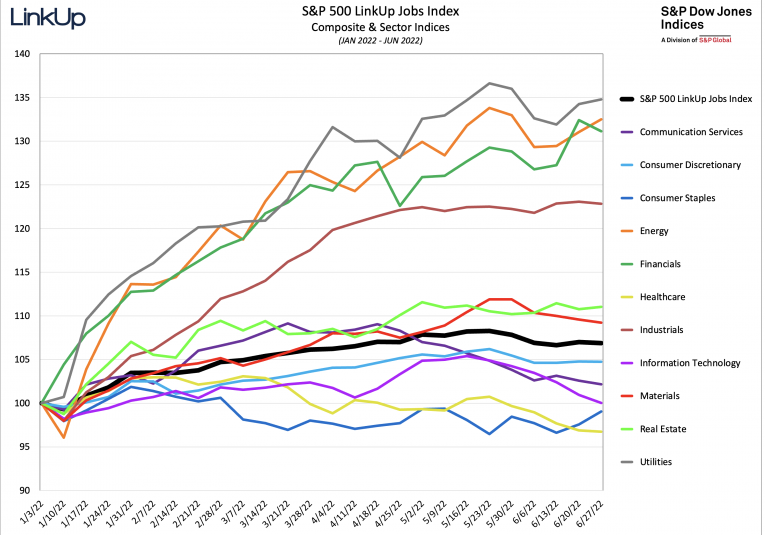
Having just returned from some time off and a tight deadline before tomorrow’s jobs report, I’ll skip the job market commentary this month and jump straight to our jobs data and our corresponding non-farm payroll forecast for June. In June, total job openings dropped 3% while new and removed jobs rose 1% and 3% respectively. Labor demand dropped 10% in the 2nd quarter and with the continued decline in total job openings in June, labor demand has returned once again to where it was last August.
Zalando is blaming its recent woes on broader industry trends. But although other European online fashion retailers are also seeing slowing sales, is there more to the story? In today’s Insight Flash, we compare Zalando’s recent spend growth to the broader industry, break down trends for urban shoppers versus the total UK, and look at whether new customer acquisition has slowed.
Taking a company public can be a long and arduous process. Yet an increasing number of companies have opted to expedite this by using Special Purpose Acquisition Companies (SPACs). SPACs can take only a few months to execute, instead of the usual 12-18 of an IPO. And they have soared in popularity over the last few years, with their share in the total number of IPOs increasing from almost a quarter in 2019 to over half in 2021. But what effects does this speed have on a company’s workforce, specifically around growth and employee well being?
June was a difficult month for brick-and-mortar retail visits. The combination of lingering inflation and high gas prices clearly took a toll. In addition, the comparisons to a stronger period in 2021 and to the beginning of the summer shopping season in 2019 only deepen that perspective. But looking at June numbers without the proper context can create a skewed view that may miss many key takeaways.
Games such as _Bridge Race_ and _High Heels_ have generated vast download numbers by removing virtually all the friction that would stop less committed users from playing. Hypercasual games are lightweight, have a scaled-down depth of content and progression and are usually free to play. This simplicity has brought millions of new gamers into the mobile gaming universe. The category scarcely existed before 2014 but in 2021 the action and puzzle hypercasual subgenres topped the download chart in 24 of 28 countries.
Heading into July, the US national average price of gas has surpassed $5 per gallon. Earlier this summer, we noted that one way consumers are striving to beat back rising gas prices is through the use of apps like GasBuddy, which saw 190% YoY increase in downloads as of June 2022. Now, amidst rising gas prices and concern over the climate crisis, there is a stark increase in demand for electric vehicles, according to data.ai’s mobile data. As of June 13, 2022 weekly downloads of the top 5 Electric Vehicle Charging apps increased 250% compared to the start of the year.
Our recent white paper dove into the retail strategies that brands are using to rightsize effectively. We analyzed store optimization plans from leading retailers to find out how closing or re-imagining a retail location can help increase foot traffic. Rightsizing doesn’t just mean closing stores – for some retailers, like Barnes & Noble, rightsizing can mean literally resizing the store area. The retailer used to command two to three story locations, but over the past few years, as much of book-selling moved online, the chain had to close locations due to a drop in demand.
It’s not every day that a pop star comments on the state of labor markets. But Beyoncé does just that with her new song, Break My Soul, an anthem of the Great Resignation. Due to this remarkable, and timely new piece, we thought it would be appropriate to pay homage to Queen Bee by providing an annotation of her latest hit, to help fans listen to this track the way it was meant to be heard: with supporting data, charts, and analysis.
The Index analyzes data from more than 100 top-tier indoor malls, 100 open-air lifestyle centers (not including outlet malls) and 100 outlet malls across the country, in both urban and suburban areas. Placer.ai uses anonymized location information from a panel of 30 million devices and processes the data using industry-leading AI and machine learning capabilities to make estimations about overall visits to specific locations.


