The future, it would seem, belongs to hybrid work. While many employers are eager to bring more people back to the office, few have set their sights on a five-day in-office work week. And though working from home has its perks, in-person meetings and social interactions with colleagues can be important for morale. The devil, however, is in the details – and as workers and bosses continue to wage the “remote work wars,” it remains to be seen just how the hybrid work week will continue to evolve moving forward.
In Indonesia’s ride-hailing market, Gojek and Grab have been dominating as the two main players. When it comes to order volume across the year 2022, the two companies are competing head to head with very close market share. As of 2023 January, the two companies equally share the market at around 50% by order volume including both two-wheelers and four-wheelers, according to Measurable AI’s very own unique e-receipts panel.
In their most recent earnings report, HFGG-ETR highlighted the variability in performance across geographies, especially reopening economies and those hit hardest by inflation. Since CE Transact Global is now able to track individual performance across seven different markets, it can provide key insights into performance differences. In today’s Insight Flash, we look at share performance for the Domestic US segment versus the International transactions for six European countries, as well as individual country growth rates and repeat purchase behavior in the US and UK.
The top 10 quick-service restaurant apps in the U.S. were downloaded 10.5 million times in February, 4.2 percent more than those the month prior. Year-over-year in the month of February, downloads of the top 36 quick-service restaurant apps are up 33.7 percent. A download represents a new user and the first conversion on the mobile app customer’s journey.
February 2022 was one of the last “typical” retail months, sandwiched between the Omicron surge of December 2021/January 2022 and the high gas prices and rising inflation that characterized most of last year. A year later, we dove into the February 2023 foot traffic data to understand how the major retail categories performed relative to this recent benchmark of normalcy.
The U.S. set a gambling record in 2022 with nearly $55b in revenue. Gambling revenue in N.J. alone topped $5b last year, matching the state’s all-time high in 2006. We can attribute much of that growth to the rise of sports betting apps, like FanDuel and DraftKings, that make placing bets as easy as liking someone’s post on Instagram. Gambling advertisers—think everything from casinos to fantasy sports leagues—have responded, increasing their investments by 40% YoY to nearly $866mm; the average monthly investment was $72mm, up from $46mm in 2021.
Navigating companies through mergers and acquisitions is a challenging task, and managing the transition process requires thorough consideration. Our previous research on mergers and acquisitions found that the geographic and role diversity of merged companies predicts future stock performance. Beyond financial metrics, it is equally important to evaluate employee sentiment and hear what they have to say about acquisitions. This week, we analyze employee sentiment in acquired companies using data from over 25,000 acquisitions between 2010 and 2020.
The past few years have seen Ulta Beauty exceeding all expectations, even as economic headwinds impacted many retail categories. The company has shown an ability to withstand the dual pressures of a pandemic and inflationary concerns, highlighting the broad appeal of beauty and self-care. With the first few weeks of 2023 behind us, we take a closer look at 2022's performance and see how the brand is faring into 2023.
The Dodge Momentum Index (DMI), issued by Dodge Construction Network, advanced 1.9% in February to 203.0 (2000=100) from the revised January reading of 199.3. In February, the commercial component of the DMI rose 1.4%, and the institutional component increased 2.9%. “The Dodge Momentum Index returned to growth in February after falling 9% last month,” stated Sarah Martin, associate director of forecasting for Dodge Construction Network. “The continued elevation in the DMI should provide hope that construction activity will grow in 2024. Owners and developers tend to put projects into planning until well after economic conditions weaken.
Amid a highly-anticipated earnings season for retailers, off-price chain Burlington (NYSE: BURL) reported earnings that beat investors’ expectations in the fourth quarter of 2022. Ahead of Burlington’s holiday quarter earnings announcement, Bloomberg Second Measure transaction data projected $2.78 billion in revenue—within two percent of Burlington’s reported revenue—while the mean consensus estimate was more than 5 percent lower than reported revenue, at $2.60 billion.
Impressively, especially considering the wider economic context, mall visits have been consistently tracking closely to year-over-year (YoY) levels for months. Yet, our January mall update showed YoY growth for the first time since July of 2022 – a potentially very strong sign to kick off the year. However, the comparison to an Omicron affected January in 2022 set up a far easier comparison than other months, putting an added importance on February performance to gauge the true state of the mall recovery.
The sportswear and sporting goods market experienced a boost during the early stages of the pandemic as fitness moved offline and people stocked up on home equipment. And though offline fitness has rebounded following its COVID-induced slump, the sports retail segment continues to grow. With 2023 already underway, we look at the changes in visits to two of the biggest names in the segment – DICK's Sporting Goods and Hibbett Sports – to see how these brands performed in 2022 and what we should expect from the category this year.
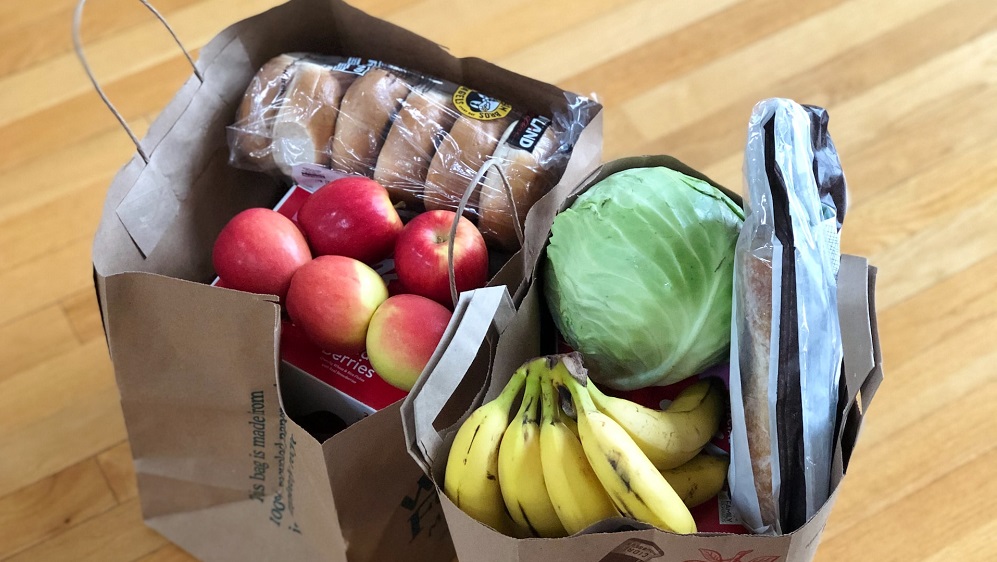
In 2022, high inflation impacted sales trends across various retail sectors in the U.S.—from big-box stores and discount chains to grocery companies. While inflation began easing in mid-2022, food prices have remained elevated throughout 2022 and into 2023. Amid rising food prices, discount grocery chain Grocery Outlet (NASDAQ: GO) saw its sales in the first two months of 2023 grow more than in comparable periods of 2021 and 2022, Bloomberg Second Measure transaction data shows. Apart from food price hikes, another possible factor behind the company’s sales growth is expansion into new markets. Additionally, our data shows growth in average transaction values, possibly due to a shift towards shopping for value.
STR’s global “bubble chart” updated through 17 February 2023 showed generally strong performance to kickstart the year. Among all countries with room supply of more than 50,000 rooms, Israel, Switzerland, Singapore, France and the United Arab Emirates led in revenue per available room (RevPAR) on an actual basis. If you recall, Israel, Switzerland and Singapore were among the top five in RevPAR during 2022 and that strength has continued early 2023.
When a company posts a job opening, how long does it take for them to fill it? When a worker loses their job, how quickly do they find another? These questions get at the same underlying relationship between available jobs and the workers able to take them—which is often called the “tightness” of the labor market. The longer it takes for employers to fill positions, the tighter the labor market. Average time-to-fill across the US economy dropped in the pandemic, then surged to a new high, where it persists now.
The car wash category has seen significant visit growth in recent years, outperforming the pre-pandemic era. Visits accelerated in 2021 as consumers pulled out of COVID restrictions with stimulus dollars in hand, eager to head out on the highways. And in 2022, back-to-the-office trends and pent-up demand for going out caused car wash traffic to reach new heights. We dove into the visit metrics in the car wash category to take a closer look at the trends driving strong foot traffic and assess where the space is headed in 2023.
This week, MediaRadar reviewed advertising from the week of February 6, 2023, and compared it to ads that ran the week of January 30, 2023. On March 1, 2023, MediaRadar will share a monthly advertising index. Automotive advertisers increased over 140% WoW to $175mm+ invested. This occurs after three consecutive weeks of ad spend declining. Automotive models were 91% of the total spend and spiked over 125% WoW.
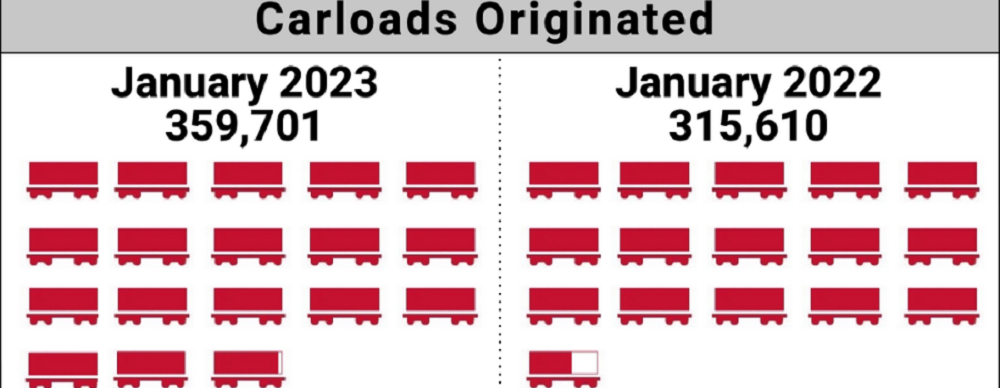
The number of carloads moved on short line and regional railroads in January 2023 was up compared to January 2022. Carloads originated increased 14 percent, from 315,610 in January 2022 to 359,701 in January 2023. Coal led gains with a 47.3 percent increase. Crushed Stone, Sand and Gravel and Nonmetallic Minerals were also up significantly, increasing 33.6 percent and 31.8 percent, respectively.
Last week, the retail world woke up to the news that Tuesday Morning – the discount home goods brand – had filed for bankruptcy for the second time in the company’s history. Tuesday Morning’s first bankruptcy filing in 2020 – a result of the challenges of operating during a pandemic – led to the permanent closure of roughly a third of the brand’s locations.
On February 22, 2023, The TJX Companies (NYSE: TJX) announced that its revenue for the fiscal quarter ending on January 28, 2023 (FY23 Q4) was $14.52 billion, a 5 percent increase from the previous year. The report, which was the first among major off-price retailers during the first earnings season of 2023, exceeded analysts’ revenue expectations.