Yesterday, August 13, the Zillow ($ZG) app achieved its highest number of daily active users (DAU) in its lifetime with 2.17 million. The app also saw a record number of app sessions (just under 6 million), and its daily downloads were the highest they've been since 2017 (about 54,000). This comes just after Zillow reported an impressive Q2 and exceeded earnings expectations.
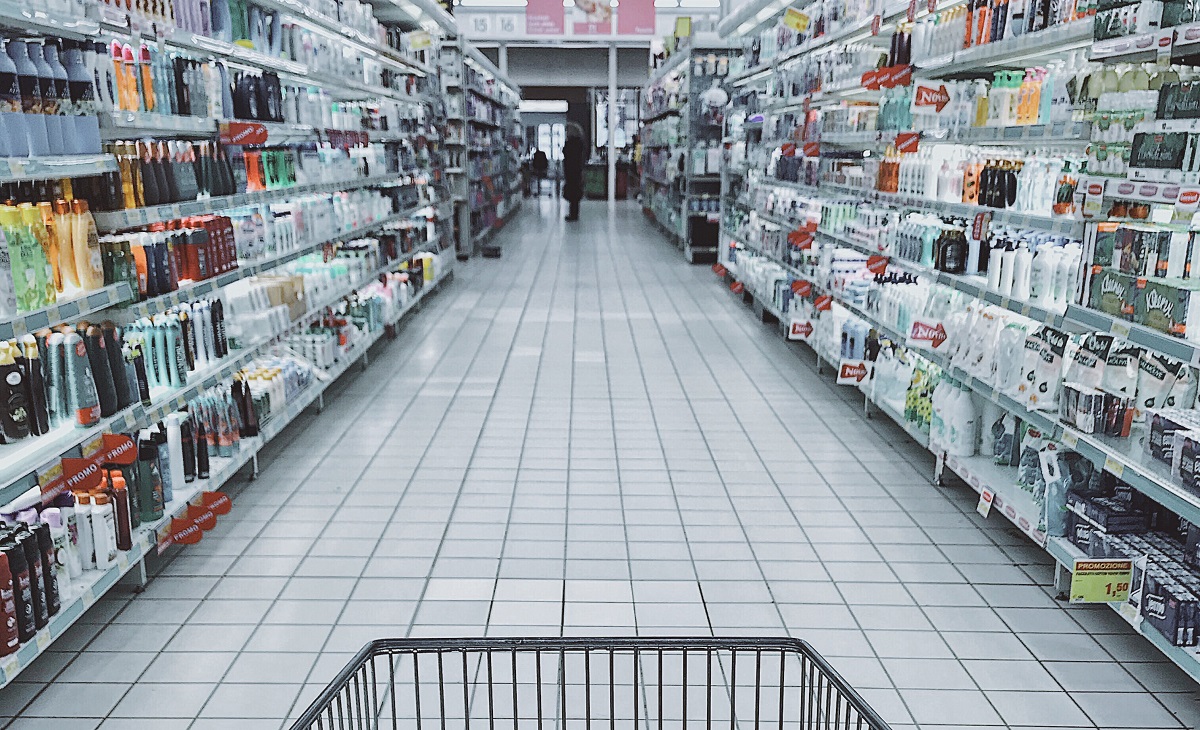
Even staple categories like grocery are facing upheaval as COVID-19 continues to impact U.S. consumer spending. While grocers themselves have seen some shifts in spending behavior, the largest change has taken place among delivery services, which saw sales increase 146 percent year-over-year.
In March and April, the home improvement sector was already showing a unique potential for a post-pandemic surge. The brands were enjoying a “lightning in a bottle” moment where essential retail status, home quarantines and an unstable economy were making their offering as valuable as possible. Yet, even for those that saw promise for the sector, the growth has been surprisingly strong and is lasting far longer than anyone could have hoped for.
At the beginning of 2020, B2B print publications received less advertising dollars than the previous year. COVID-19 only accelerated that trend. Here, we dive into how the pandemic is affecting B2B print and the advertising trends shaping the shifts publishers face.
The proportion of workers travelling to their offices is holding steady at around 18% of pre-lockdown levels in the UK, as Huq’s high-frequency geo-data offers clues as to the impact of the new a work-from-home norm. Office-based workplace presence dropped to near-zero when lockdown came into effect at the end of March with presence seeing a slight increase towards the end of May as it ended.
In July, over a thousand advertisers paused their spending on Facebook. The campaign did not have a significant impact on Facebook’s revenue—but did those advertisers divert those dollars elsewhere? MediaRadar did an analysis of thirty large brands who participated in the boycott—including Coca-Cola, Unilever, Verizon, and more—to see how these brands advertised across multiple channels in July.
In this Placer Bytes, we dive into Kohl’s amidst wider concerns over the future of the department store and the impressive performances across the TJX portfolio. Kohl’s has experienced a strong recovery in recent months with June and July down just 26.7% and 26.1% year over year. And while this still marks significant declines, the brand has been hit hard by COVID resurgences in key states like California and Texas where they have a greater number of stores.
In this Placer Bytes we dive into the data and recoveries for three major apparel retailers – Macy’s, JCPenney and Dillard’s. Macy’s started off 2020 with mixed results, with year-over-over visits for January down 0.9% but up 6.4% for February. As expected, visits dropped to 62.7% down for March as coronavirus hit the United States, and continued to decline into April – bottoming out completely.
In the last week, footfall across the UK’s foodservice sector has come close to 50% of pre-lockdown levels, but in the main appears to have steadied at around 35% since establishments re-opened for dine-in on July 4th. Both restaurants and quick-service outlets both achieved their highest levels since lockdown began, with restaurants peaking at 45pts on August 5th in contrast to quick-service’s high of 46pts following Super Saturday in early July.
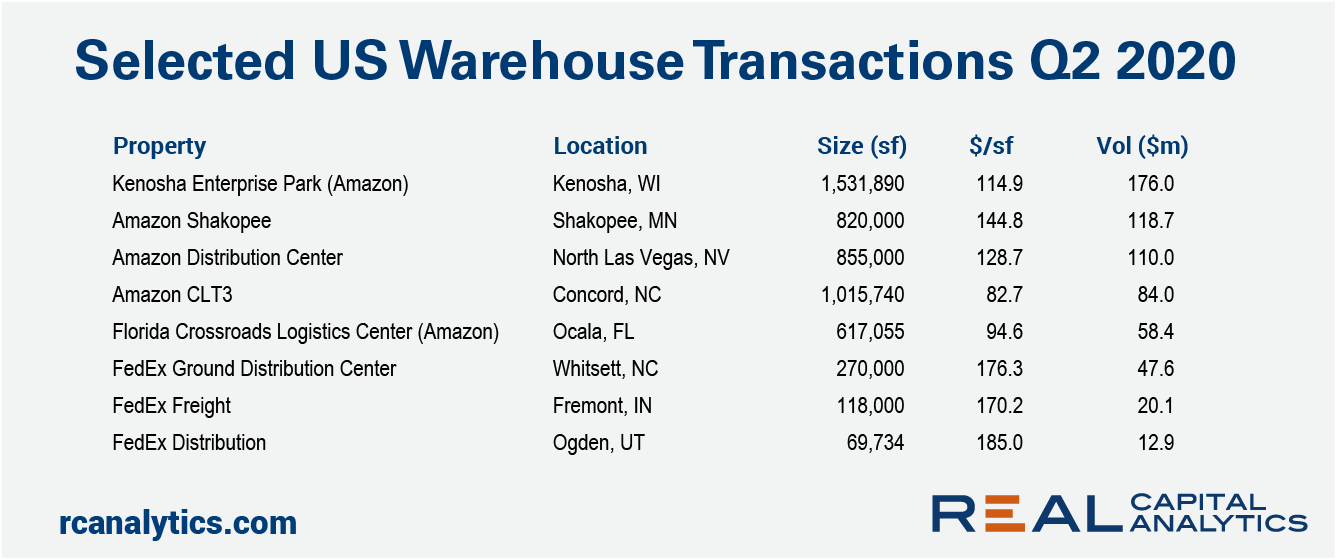
Distribution warehouses continued to be a target for investors in the second quarter of 2020 amid heightened attention on the backbone of logistics infrastructure. While sales activity in the U.S. industrial sector dropped during the quarter, buffeted by lockdown restrictions and economic uncertainties, the sector’s decline was the smallest of any major property type. And, of the $11.1 billion in industrial transaction volume, around one-third came from sales of distribution warehouses.
With Walmart and Target among some of the brands announcing that they won’t be opening this Thanksgiving, a lot of attention is going to focus on Black Friday’s ability to make up the difference. So, is Black Friday still as critical as we think? And how might traffic patterns change if more retailers close on the day before?
Traditional B2B marketing plans were scratched this year—shifting many ad dollars to digital channels. Prior to COVID-19, the Center for Exhibition Industry Research reported that B2B marketers who participated in events spent about 40% of their budgets on trade shows, which was five times more than online marketing spending. This year, trade shows and exhibitions are not taking place—and digital B2B ad spending is growing.
TikTok is a big deal in business and in pop culture. You already know that it, along with 59+ other Chinese published apps, has been banned in India and that a ban or sale of TikTok is likely to take place in the United States. The reasons why this is all taking place can be as complicated or as simple as you want them to be depending on who you talk to, but that’s not what this blog covers. We cover data trends, market shares, etc.
Consumer ad spending has had big swings this year. Each industry has had a different response to COVID-19, but flexibility remains at the core of it all. Let’s take a look at the ad spending most impacted by the latest rise in cases.
When Disney reopened in a hard-hit Florida, there was little anticipation of normalcy, but many felt the reopening failed to live up to expectations. Even comparing weekly visits to crosstown theme park rival Universal Studios saw Disney with larger gaps in terms of year-over-year traffic for the weeks of July 6th and July 13th. Yet, not only is the growth coming for Disney, but even the gap with Universal is also closing.
In May, manufacturing was one of the first industries to start reopening. There were many unresolved issues surrounding employees, supply chains, and bringing back operations. Some companies felt that their markets would be destroyed without outside assistance. Some experienced more bumps than others. For example, it only took two days before a reopened Ford factory reclosed its doors.
MediaRadar research found that the number of advertisers running programmatic ads is up 26% since January. In June, spend levels hit their highest point since January. In fact, spend levels in June were down just 3% when compared to January. Advertising company Criteo also reported that market conditions in May improved and revenue trends were better than expected.
In H1 2020, Kantar noted decreases in both Print and Digital promotion activity as brand manufacturers and retailers adjusted their coupon strategies in response to COVID-19. In Digital, we saw a decline in estimated prints/clips beginning in March as well as shorter coupon availability with average days online down 50% to just 9.5 days in March, April and May 2020.
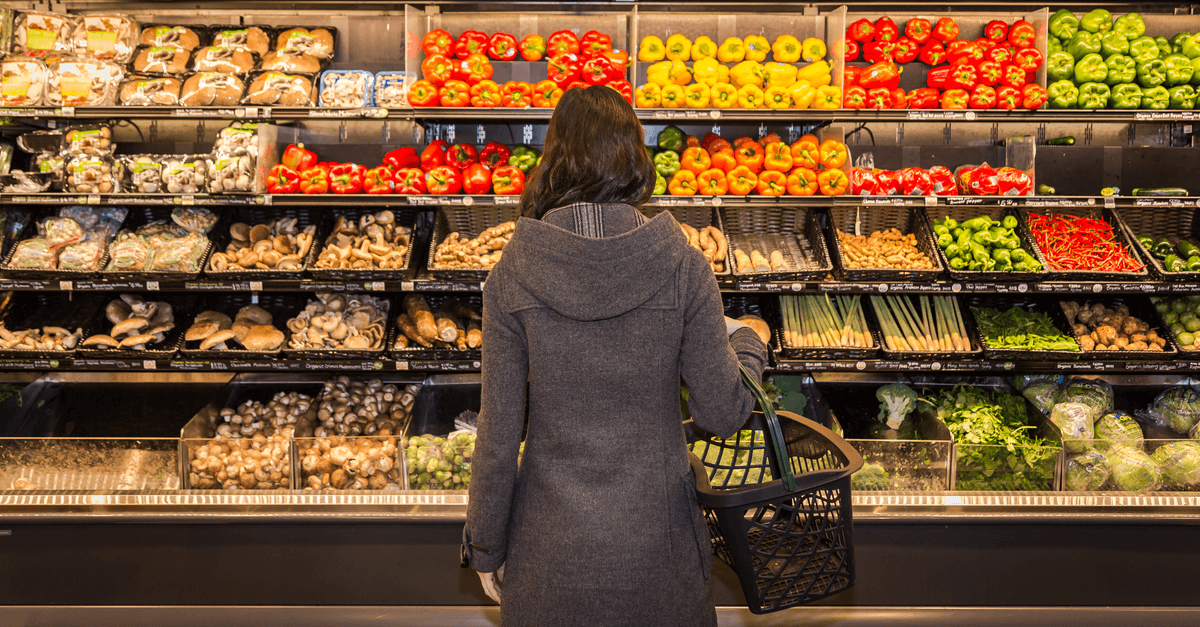
Sprouts was a brand in the midst of a very strong run heading into 2020. Between 2018 and 2019, the brand saw visitor growth of 3.2% and 2020 kicked off with small, but respectable year- over-year visit increases of 0.2%, 3.5%, and 2.1% for January, February, and March respectively.
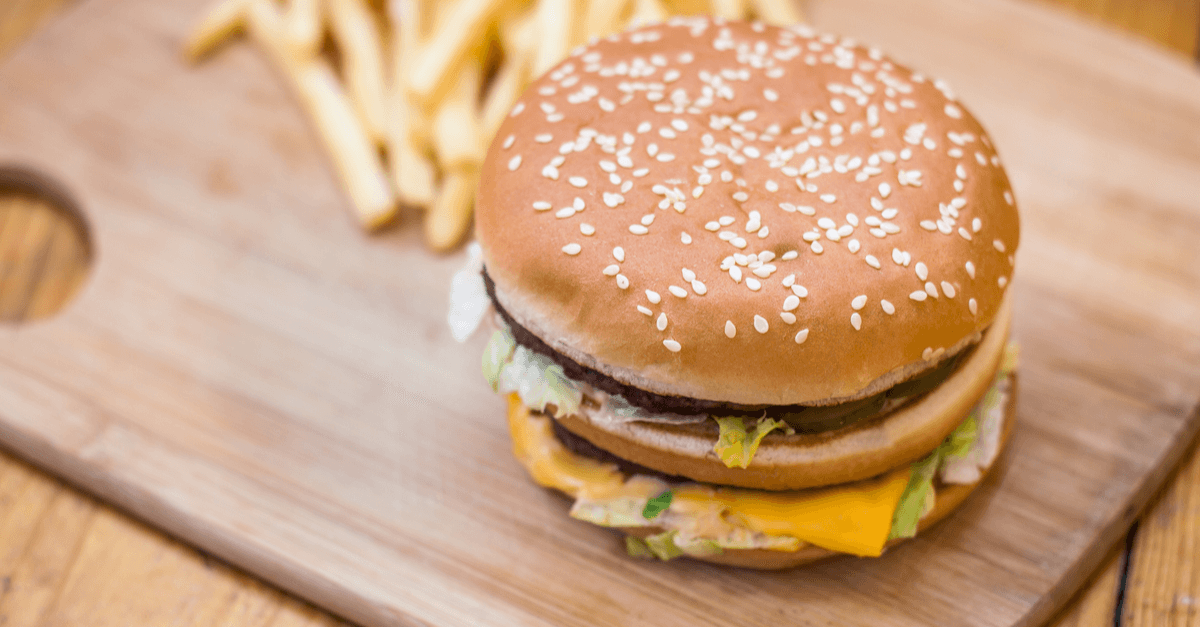
In this Placer Bytes we take a bite out of McDonald’s, dive into the data surrounding Yum! Brands and check in on The Cheesecake Factory. One of the top QSR players, McDonald’s had a strong start to 2020. Monthly traffic for the brand was up year-over-year 7.9% and 13.4% for January and February respectively.