Annual federal tax refunds have been a reliable source of additional spending cash for American taxpayers. Covid-19 upended the regular February-April cadence of payments as many households received additional stimulus payouts and tax credits that almost doubled the amount normally deposited by the government. This tax season marks a return to more normal refund behavior, which could signal sales declines for retailers who benefited from consumers’ extra cash in 2020 and 2021.
Retention rates for crypto apps remain steadily higher than stock trading apps in Q3 and Q4 of 2021. For example, crypto app retention sits at 32% on Day 1 in Q3 in 2021, while stock trading apps average at 19%. In our most recent report, Fintech deep dive: digital currencies 2022 playbook, we collaborated with marketing analytics platform, Adjust to dive into the key drivers of cryptocurrency app adoption in 2021.
Shopify’s ( $SHOP ) software and services provide relatively simple solutions for helping people and businesses sell things online. This was a power position in the early days of the pandemic when businesses were strongly compelled to embrace e-commerce. During that time, Shopify provided the path of least resistance and it quickly became the default choice.
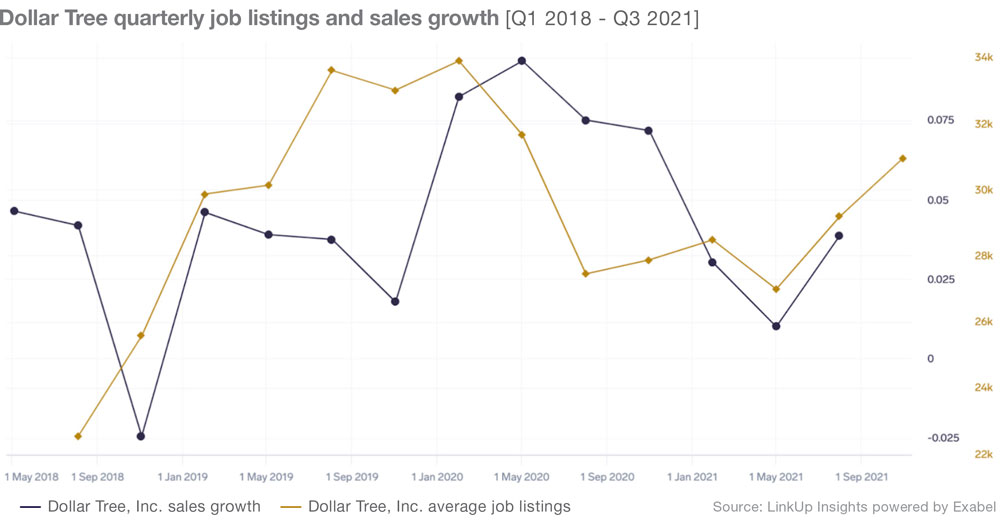
Dollar Tree is due to report earnings Wednesday and seems to be in a very interesting position. On one hand, they announced last quarter they would be raising their prices, after testing and finding customers would tolerate these price increases. On the other hand, reports have been recently released that they will have to shut down 400 stores indefinitely due to a rodent infestation.
For the first month of 2022, active job listings in the U.S. were, for the most part in a somewhat steady holding pattern, up just 0.3% over December. When we drill down to the occupation level we see some hidden booms (hello, Food Service and Computer and Mathematical occupations) and slides (we see you Healthcare, Transportation and Supply Chain). But overall things remained on a relatively even keel in January.
Initial filings for jobless claims declined for the second week in a row at the end of January, indicating that the labor market is recovering from the temporary disruption caused by the Omicron variant. According to the newest Unemployment Insurance Weekly Claims Report released on February 3rd, initial jobless claims, a proxy for layoffs, fell to 238,000 for the week ended January 29th, a decrease of 23,000 from the revised level the week before.
Escalating urgency behind the ongoing climate crisis continues to drive many facets of the economy forward. From growing technologies like electric vehicles to areas of potential job creation like infrastructure, opportunities to benefit from our collective problem solving abilities abound. But now we’re witnessing an interesting shift among investors, toward funds with more sustainable stocks. Those new to the market and seasoned investors are both showing interest in companies making measurable impact in addressing important environmental issues, as well as the social issues that fuel them
Higher salaries in big cities do not always translate into higher standards of living because the cost of living varies greatly across cities. By tracking salaries by location, we’re able to see where employees can enjoy the highest standard of living. The matrix below illustrates the average salary of job postings and cost of living in an MSA. So what is the price tag of living in your city? We can use price indices across metropolitan areas and average salaries, to see the ‘premium’ you receive or ‘tax’ you pay on average by living in a city.
Our nation’s infrastructure is set to get a massive funding boost courtesy of the Federal government’s American Rescue Plan Act and bipartisan Infrastructure Investment and Jobs Act. In their new report entitled Hard-to-Fill Infrastructure Jobs: A Challenge to Building Our Future the National League of Cities explores the labor market’s readiness for the influx of infrastructure jobs that will be created by these new funding streams. An infrastructure job is one in which the work required is related to the design, construction or maintenance of infrastructure
When Dolly Parton spun her classic 9-to-5 into an ode to side hustles for Super Bowl commercials, it sparked controversy as to whether hustle culture is the new norm. But is this really a _'whole new way to make a livin’_? By looking at online profiles who list more than one concurrent position, we can track the rise and fall of hustle culture in the American economy:
Roughly twice as many Americans retired in the first fifteen months of the pandemic than they did in 2019. Some of these retirements were by choice—driven by increased investments and a refocus on what matters in life. Others were involuntary—people in struggling industries were laid off and didn’t return to work. While there is a “Great Resignation” happening across all working age groups, Baby Boomers are leaping into early retirement—ready or not. And financial planners have found themselves in demand. How are we seeing financial services bring customers in?
Londoners are staying closer to home than residents of other towns and cities as the country counts on a post-Covid recovery. Since the depths of lockdown England during January 2021, Huq’s measure of population mobility – that is, the mean maximum distance travelled each day – has recovered 50% as a whole. While residents in The South and North are building towards 75% and 86% of pre-pandemic levels respectively, London lags 35% behind at just 50%.
It appears we’re closing the summer on a hot streak as overall job listings continued to rise in August for the 6th month in a row. While the trajectory is positive, the pace of growth continues to slow with August non-farm payroll numbers missing estimates and another increase in the number of jobs deleted in our database. This could be a sign of a broader slow-down, but we would anticipate hiring will accelerate ahead of the holiday season.
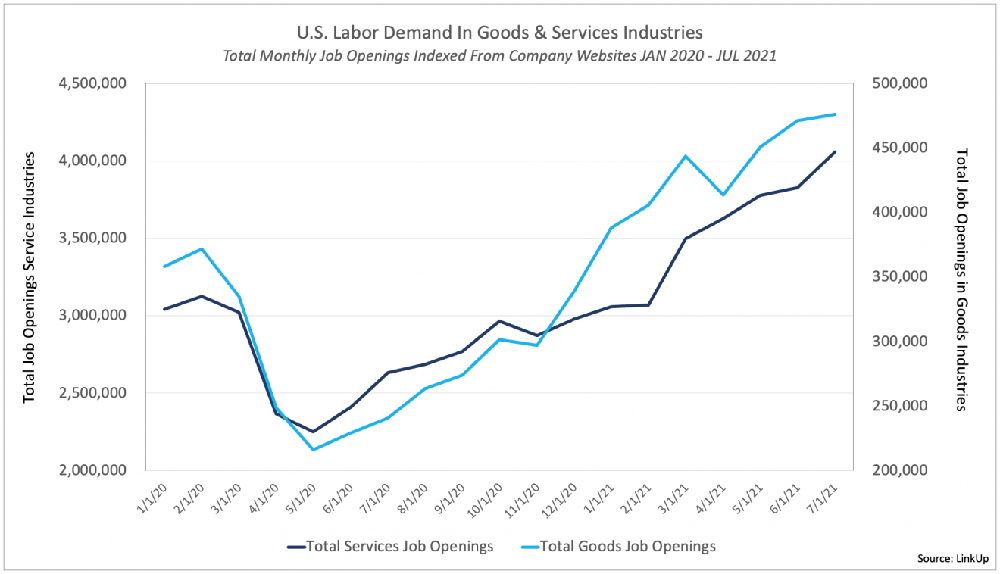
We’ll post updated charts later this week when we get our data for August, but we wanted to post the two charts below that show total (below) and new job openings (bottom) in goods and services industries between January 2020 and July 2021. As the first chart below for total job openings shows, between May and November last year, labor demand in services industries rose faster immediately following the decimation of Q2 ’21 than goods-producing industries.
Temperatures weren’t the only thing rising in July, as sky high summer heat was accompanied by increasing job listings, with the month up 4.6%. This follows the slowdown observed in June where listings dipped by almost 1%. Reflecting on job demand changes overall, it is noteworthy that over the last year, only two months have seen a decline in listings, and growth continues.
For some school districts*, the back-to-school shopping season has arrived. Following a year of mostly remote learning and a resulting stunted 2020 school shopping period, we looked at our data to see if 2021 would be any different. Good news for retailers: a return to in-person classes and some extra cash from the first Child Tax Credit payment shows the retail tide may be turning.
Last month, the US government made one of what will become several monthly payments to households with children, meant to spur spending and reduce economic hardship. In today’s Insight Flash, we take advantage of our unique demographic capability to isolate households with children, and to cross-reference that by income, to evaluate the impact of this payment. Households with children began ramping spending in advance of the payment, moving from lower spend growth than shoppers without children the week of June 6 to slightly higher growth the weeks ending June 13 – July 11.
According to The Economist, just 10% of the world’s population is fully vaccinated against Covid. This average conceals a huge global divide – for low-income countries, the average is just 1%; it is over 30% for the most advanced economies. Even in the developed nations, the formula for vaccine rollout success is a complex blend of politics, economics, public health preparedness and national attitude. But it is clear that the economic bounceback will be led by the largest and most developed economies.
The phrase “no place like home” took on new meaning for many at the height of the pandemic, with much of the country pivoting to a new normal of quarantine and remote work. Some of the biggest beneficiaries of this development were the Home Improvement and Home Furnishing sectors as consumers increasingly took on DIY home projects and invested in home offices—to the tune of $420 billion last year.
In our Non-farm Payroll forecast earlier this month, we highlighted the yawning chasm of the bid-ask spread between employers and employees these days and touched on some of the structural mechanics of the job market in the context of how efficient or inefficient the job market is (typically), how COVID has obliterated any normalcy that might have previously existed in the job market, and what we expect to see in the coming months.


