The CoreLogic Home Price Insights report features an interactive view of our Home Price Index product with analysis through July 2021 with forecasts from July 2022. Home prices nationwide, including distressed sales, increased year over year by 18% in July 2021 compared with July 2020 and increased month over month by 1.8% in July 2021 compared with June 2021 (revisions with public records data are standard, and to ensure accuracy, CoreLogic incorporates the newly released public data to provide updated results).
Manufactured housing represents a small share of the U.S. commercial real estate market, at approximately 1% of total deal volume, but activity in this alternative sector is gaining momentum. Sales of individual properties reached the highest levels yet in the second quarter. Acquisitions in the four quarters through Q2 2021 totaled $4.1 billion, up 48% compared with the prior four quarters and 30% above the average seen since 2017.
Welcome to the September Apartment List National Rent Report. Our national index increased by 2.1 percent from July to August, a slight cool-down from 2.5 percent the month before, but nevertheless a continuation of rent growth that has persisted since the start of the year. Since January 2021, the national median rent has increased by a staggering 13.8 percent. To put that in context, rent growth from January to August averaged just 3.6 percent in the pre-pandemic years from 2017-2019.
Investor activity in real estate markets during the COVID-19 pandemic has mirrored the market as a whole. Investor purchases reached their lowest point in May 2020 with a year-over-year decline of 36%. Since then, they’ve still only recovered with a year-over-year increase of 12% in December of last year. Given the all-encompassing nature of the COVID-19 recession, this should not be surprising. Even though investor purchases are up, their market share is down.
U.S. commercial real estate sales climbed in July and the rate of price growth accelerated as most but not all property sectors advanced past the pandemic recovery phase. Deal volume for the month rose 74% from a year ago and was above the average pace set across each July since 2005. The apartment sector was the lead destination for capital in July, constituting 35% of total commercial real estate investment, the latest edition of _US Capital Trends_ shows.
Consumer confidence has risen to its highest levels since the onset of the pandemic. But while many consumers are planning to buy homes, cars, and major appliances, there are still about 2 million homeowners behind on their mortgage payments and/or in forbearance programs. Fortunately, a multitude of loss mitigation waterfalls, many forbearance safeguards and an abundance of home equity have given those borrowers an opportunity to keep their homes when the foreclosure crisis finally sunsets.
Australia’s industrial sector is going through an extended purple patch, so it comes as little surprise that yields are trending down across all price brackets. Still, the more significant industrial deals have seen yields compress more so than the smaller end of the market, as investors appear willing to splash out to secure a premium offering. Yields on transactions in excess of A$100 million are now trading at an average of 4.8%, down from 6.3% just two years ago.
In a year when people have yearned for a return to normal, the rental market has been anything but. Not only are rent prices rising, they are rising tremendously fast and rising virtually everywhere. According to our national rent estimates, prices jumped over 11 percent in the first half of 2021, more than doubling the rate of inflation and more than tripling the typical rent growth we measured in the several years preceding the pandemic. Today, 87 of the nation’s 100 largest cities have fully rebounded to pre-pandemic rent prices
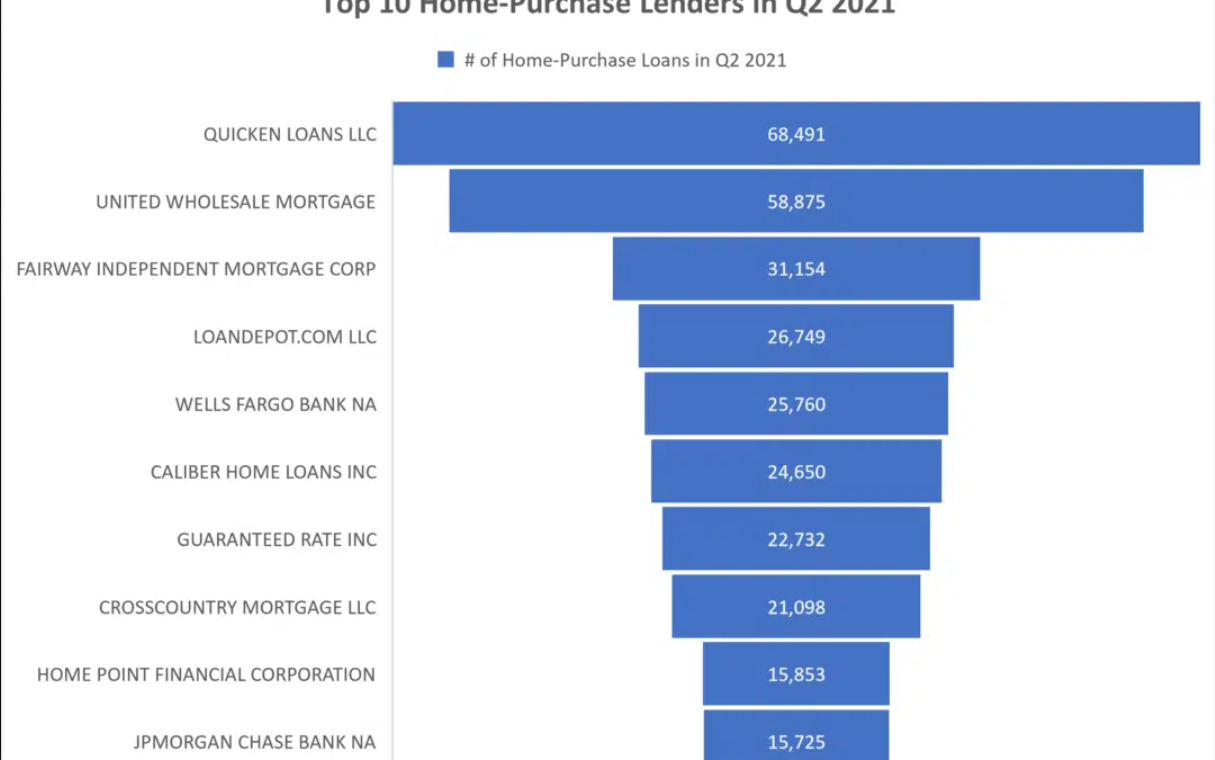
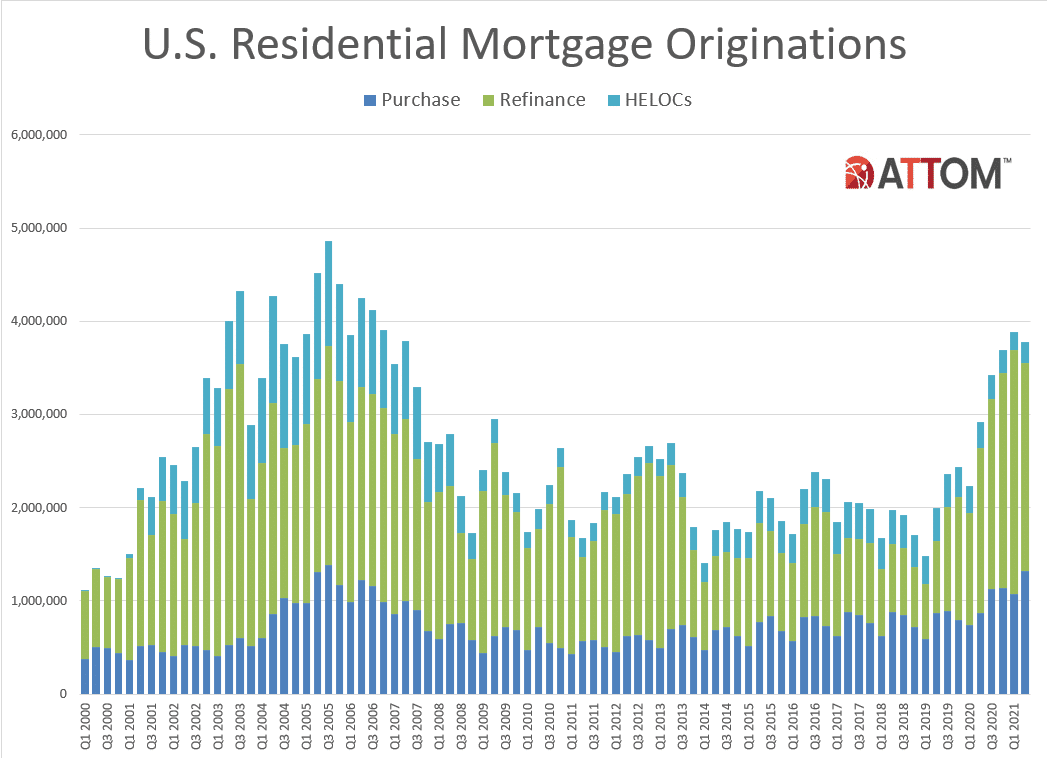
ATTOM’s newly released Q2 2021 U.S. Residential Property Mortgage Origination Report revealed that the number of mortgages secured by residential property originated in Q2 2021 in the U.S. was up 29 percent from Q2 2020, but down 3 percent from Q1 2021. According to ATTOM’s latest residential property mortgage origination analysis, the quarterly decline in overall mortgage lending in the U.S. marked the first decrease since early in 2020, as well as the first time that happened from a Q1 to a Q2 period since 2011.
ATTOM, curator of the nation’s premier property database, today released its second-quarter 2021 U.S. Residential Property Mortgage Origination Report, which shows that 3.78 million mortgages secured by residential property (1 to 4 units) were originated in the second quarter of 2021 in the United States. That figure was up 29 percent from the second quarter of 2020, but down 3 percent from the first quarter of this year.
For many millennials, the pandemic has been anything but an obstacle to leaving their rent-based urban lifestyle behind and settling down — and for good reasons. With plummeting interest rates, the timing to buy homes and invest in wealth-building homeownership couldn’t have been more perfect. Shelter-at-home and remote work have driven a desire for larger living space and privacy which are often lacking in apartments.
Global commercial property price growth accelerated in the second quarter of 2021, the third successive quarter of increasing gains. The headline price index rose 4.8% from a year prior and 1.5% from the previous quarter, the latest _RCA CPPI Global Cities_ report shows. Seoul posted the largest price increases into midyear. Prices rose 22% year-over-year, bolstered as domestic investors who had been thwarted by global travel restrictions employed their spending power at home.
U.S. single-family rent growth increased 7.5% in June 2021, the fastest year-over-year increase since at least January 2005\[1\], according to the CoreLogic Single-Family Rent Index (SFRI). The index measures rent changes among single-family rental homes, including condominiums, using a repeat-rent analysis to measure the same rental properties over time. The June 2021 increase was more than five times the June 2020 increase, and while the index slowed to a post-pandemic low last June, rent growth is running well above pre-pandemic levels when compared with 2019.
The rate of multifamily rent growth so far in 2021 has been much discussed recently as gains have reached dazzling levels on the back of historic apartment demand. Asking rent increases have contributed mightily to the growth, but the continued retreat of lease concessions has played a major role as well. As always, numbers will refer to conventional properties of at least 50 units.
The CoreLogic Loan Performance Insights report features an interactive view of our mortgage performance analysis through May 2021. Measuring early-stage delinquency rates is important for analyzing the health of the mortgage market. To more comprehensively monitor mortgage performance, CoreLogic examines all stages of delinquency as well as transition rates that indicate the percent of mortgages moving from one stage of delinquency to the next.
The nation’s overall delinquency rate was 4.7% in May. All U.S. states and metro areas posted annual decreases in their overall delinquency rates. In May 2021, 4.7% of home mortgages were in some stage of delinquency (30 days or more past due, including those in foreclosure), which was a 2.6-percentage point decrease from May 2020 according to the latest CoreLogic Loan Performance Insights Report. However, overall delinquencies were still above the early 2020 pre-pandemic rate of 3.5%.
Consumer confidence has risen to its highest levels yet since the onset of the pandemic. And while many consumers are planning to buy homes, cars and major appliances in the coming months, there are still about 2 million homeowners behind on their mortgage payments and/or in forbearance programs. Nevertheless, as COVID-19-related economic restrictions lessen and federal- and state-level protections expire, so will the forbearance programs.
Mortgage rates hit a record low in the U.S. at the beginning of 2021. That was one factor that led to the acceleration in annual home-price growth to double-digit levels this year in many communities. While each of us may see the pick-up in price growth in our neighborhoods, that experience is not unique to Americans. Many countries chose aggressive economic policy to combat the 2020 recession. As examples, the central banks in the U.S., Australia, Canada, and New Zealand cut interest rates.
For a third consecutive week, occupancy remained above 70% (25-31 July 2021), but that was down from the pandemic-era high (71.4%) achieved in the previous week. While occupancy slipped, average daily rate (ADR) advanced to yet another record high (US$143) on a nominal basis. Nominal revenue per available room (RevPAR) stayed above US$100 for a second week, though it also fell from the previous week’s level. On a total-room-inventory basis (TRI), which accounts for temporarily closed hotels, weekly occupancy was 67.5% and nominal RevPAR was US$97.
ATTOM, curator of the nation’s premier property database, today released its second-quarter 2021 U.S. Home Equity & Underwater Report, which shows that 34.4 percent of mortgaged residential properties in the United States were considered equity-rich in the second quarter, meaning that the combined estimated amount of loans secured by those properties was no more than 50 percent of their estimated market value. The portion of mortgaged homes that were equity-rich in the second quarter of 2021


