ATTOM Data Solutions’ newly released Q1 2020 U.S. Home Sales Report reveals that the typical Q1 2021 home sale in the U.S. generated a profit of $70,050, down from $75,750 in Q4 2020, but still up 26 percent from $55,750 in Q1 2020.
Since the pandemic began over a year ago, a supply shortage of for-sale homes has fueled home price growth. The national CoreLogic Home Price Index posted double-digit year-over-year growth in February. In other words, home price growth has doubled since the time just before the pandemic.
ATTOM Data Solutions, curator of the nation’s premier property database, today released its first-quarter 2021 U.S. Home Sales Report, which shows that profits for home sellers nationwide were again up on an annual basis in yet another sign of how the housing market is fending off economic damage caused by the Coronavirus pandemic. The report reveals that the typical first-quarter 2021 home sale in the United States generated a profit of $70,050. That was down from $75,750 in the fourth quarter of 2020 but still up 26 percent from $55,750 in the first quarter of 2020.
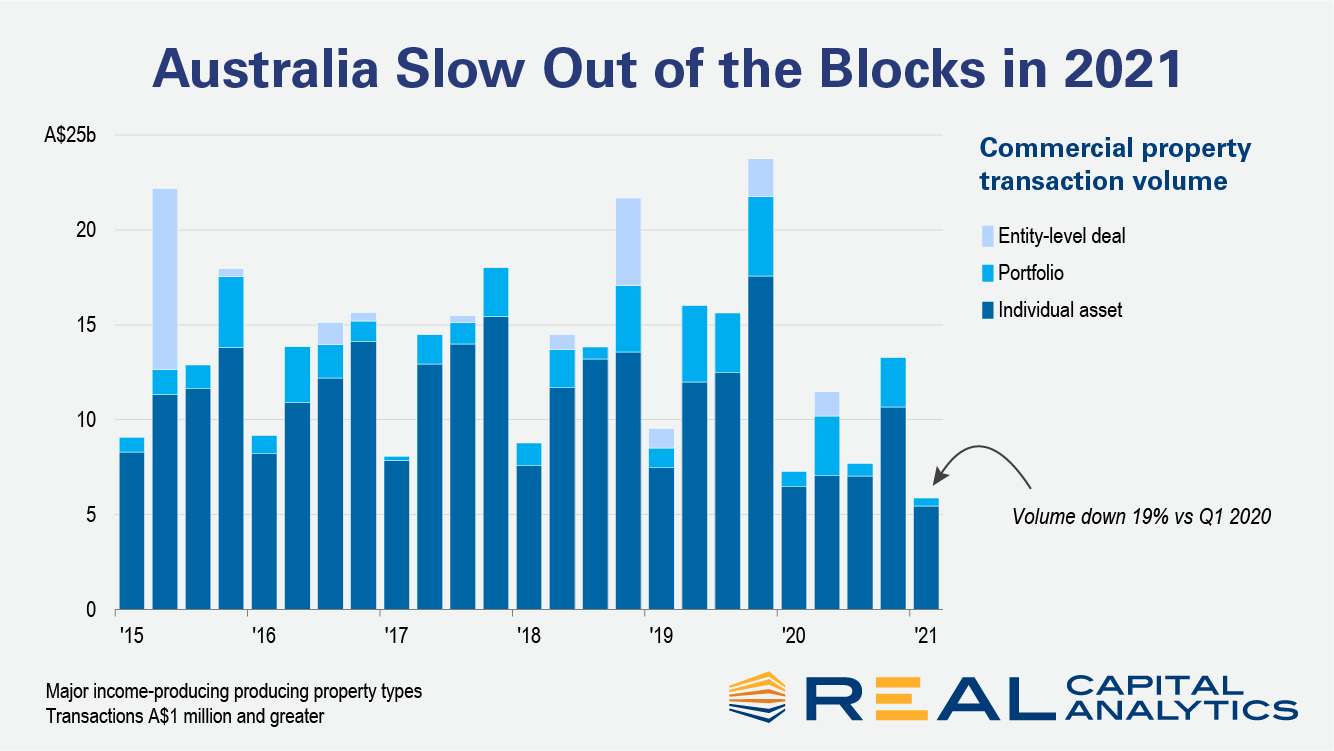
Commercial real estate activity in Australia started 2021 on a weak note, as the pandemic continued to weigh heavy on investor minds, the new edition of Australia Capital Trends shows. Deal volume in the first quarter fell 19% from a year prior.
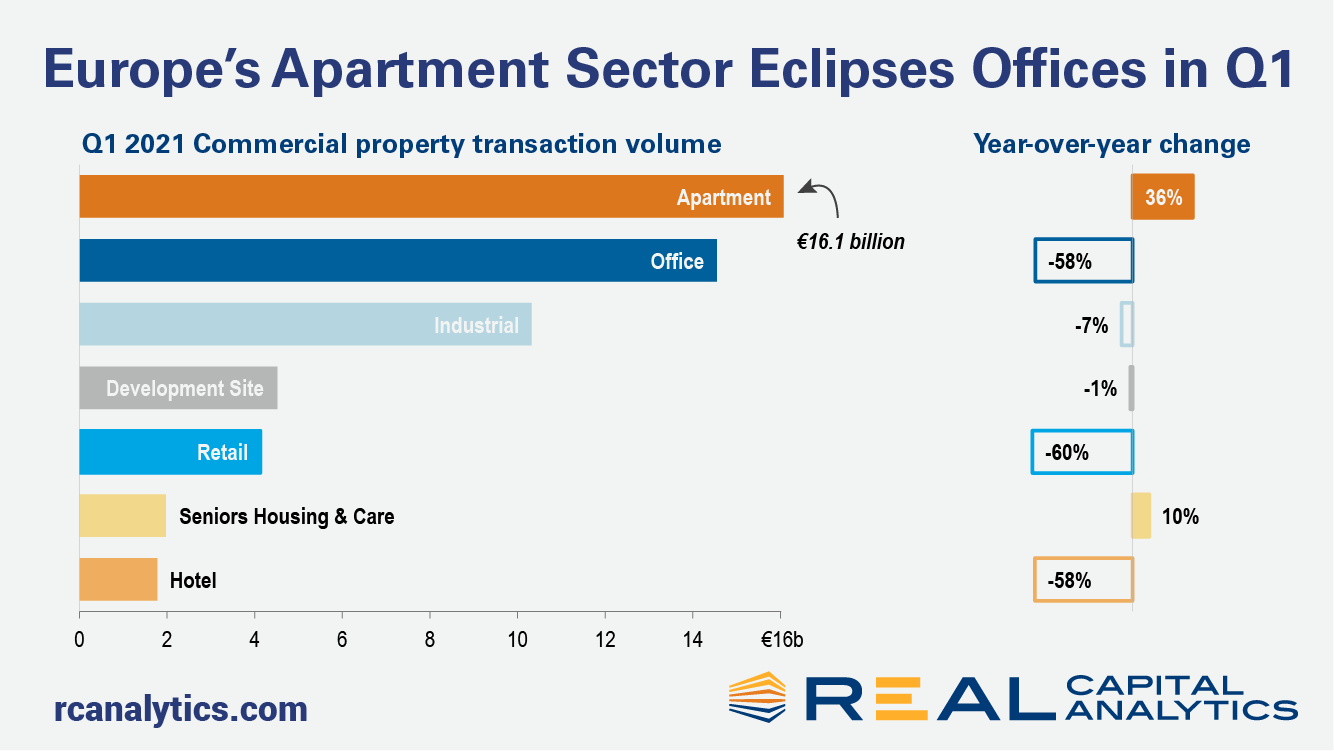
European commercial property sales sales slowed again at the start of 2021, the fourth consecutive quarter that Covid challenges have restrained the region’s largest markets, the latest edition of Europe Capital Trends shows. However, the picture for the sectors was not uniform as investors continued to plow capital into the apartment sector, which surpassed offices in quarterly deal volume. Investment volume across all property types dropped 32% in the first quarter compared to a year ago. The apartment sector bucked the trend, with activity increasing 36% year-over-year. The industrial sector slipped just 7% while acquisitions of office and retail properties tumbled by more than 50%.
This month’s data shows rent rebounds accelerating in markets across the country. Our national index increased by 1.9 percent over the past month, the largest monthly increase ever in our estimates, going back to the beginning of 2017. The data continue to exhibit significant regional variation, but the days of plummeting rents in pricey coastal markets are officially behind us. Although rents in San Francisco are still down 19.5 percent year-over-year, the city has seen prices increase by 7 percent over just the past two months. 9 of the 10 cities with the sharpest year-over-year declines have now had three consecutive months of rising rents. At the other end of the spectrum, many of the mid-sized markets that have seen rents grow rapidly through the pandemic are showing that there’s still steam left in the current boom -- Boise rents jumped by another 5.2 percent this month, the biggest increase among the nation’s 100 largest cities.
Strong acceleration of S&P CoreLogic Case-Shiller Index continued into early months of 2021 with the third consecutive double-digit increase – up 12% year-over-year in February. The month-to-month index also surged 1.05%, making it the strongest January-February increase since 2005. Further acceleration in home price growth is reflecting many of the positive and continually improving signs of the economic recovery, including employment gains, consumer savings resulting from less discretionary spending over the last year, and hence more purchase power among home buyers, and still historically low mortgage rates. As a result, competition among buyers continues to intensify leading to fewer days on the market and higher offering prices than would be seasonally the case early in the year.
According to ATTOM Data Solutions’ newly released Q1 2021 Special Report, spotlighting county-level housing markets around the U.S. that are more or less vulnerable to the impact of the virus pandemic, states along the East Coast, as well as Illinois, were most at risk in Q1 2021 – with clusters in the New York City, Chicago and southern Florida areas – while the West continued to face less risk. ATTOM’s most recent Coronavirus housing impact analysis revealed that first-quarter trends generally continued those found in 2020, but with smaller concentrations around several major metro areas. The reported noted the number of counties among the top 50 most at-risk was down in the New York, NY; Philadelphia, PA and Washington, D.C. metro areas.
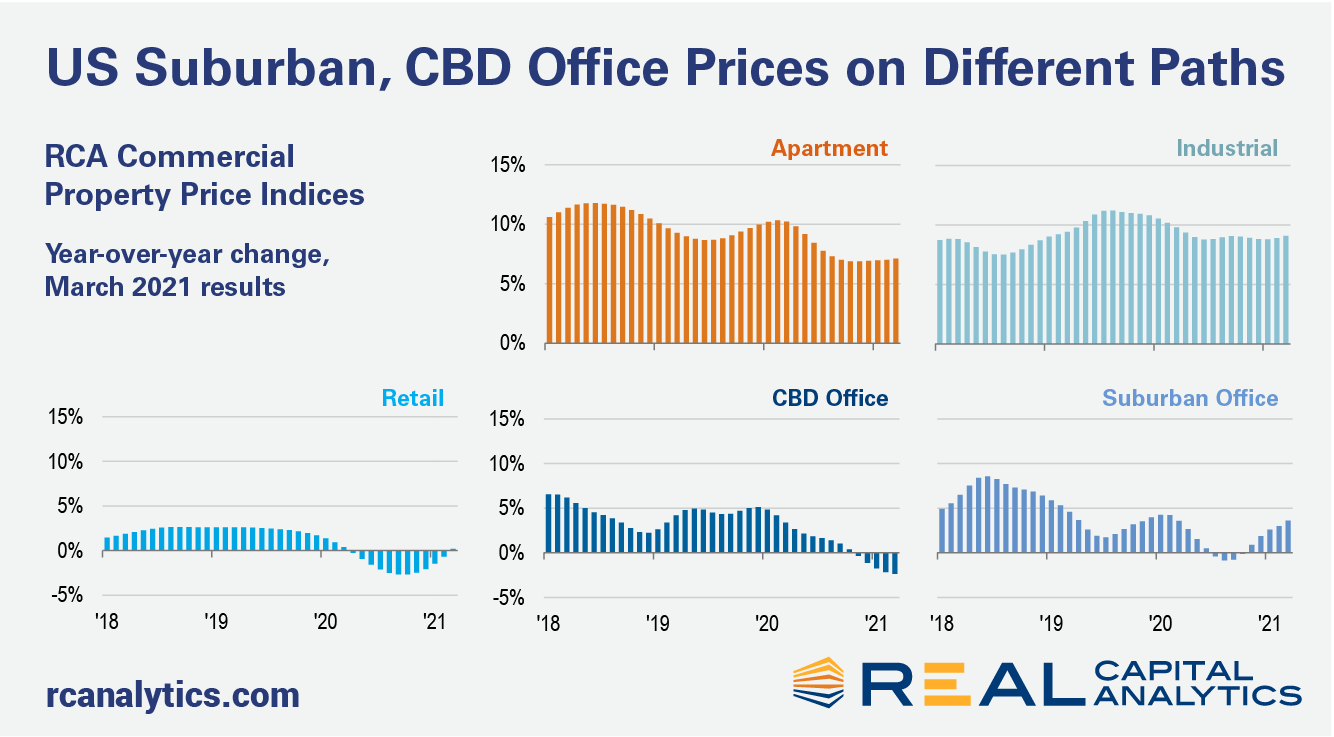
The headline annual rate of U.S. commercial property price growth posted a stronger gain in March, aided by industrial, apartment, and suburban office price increases, the latest RCA CPPI: US summary report shows. The office sector subtypes continued to move in opposite directions in March. The CBD index declined 2.4% year-over-year, while suburban office accelerated to a 3.6% annual pace of growth. The differing paces reflect the recent outperformance in suburban deal activity, as shown in the new edition of US Capital Trends, also released this week.
U.S. commercial real estate activity rose in March compared to a year ago, with deal volume increases seen for most of the major property sectors, the latest edition of US Capital Trends shows. For the first quarter in total, deal activity dropped by nearly 30% compared to Q1 2020. March deal volume increased 11% versus March 2020 when the Covid crisis first erupted and cracks started to show in U.S. deal activity.
In this month’s ALN newsletter, first quarter multifamily performance was evaluated. One interesting perspective that was not covered was a look at the quarter by market tier. ALN assigns each market to one of four tiers based on the level of multifamily stock in the market, with Tier One markets being the 33 largest in the US and markets decreasing in size down to Tier Four. Considering only conventional properties of at least 50 units, let’s take a closer look at how these market tiers performed to start 2021.
While home prices skyrocketed in response to low interest rates and low housing stock, single-family rental properties have also experienced a pickup in rent price growth. Single-family rents posted 3.9% year-over-year growth in February 2021; this was the strongest February in the past 5 years, as measured by the CoreLogic® Single-Family Rent Index (SFRI). Recovering from the low of 1.4% year-over-year growth in June 2020, the index has shown solid increases since the second half of 2020, propped up by the rent growth in detached properties. By October 2020, the rent growth compared to a year prior had returned to pre-pandemic levels.
The COVID-19 pandemic has highlighted the importance of homeownership and its impact on wealth accumulation among American households. Home prices soared, and among homeowners with a mortgage, the average equity gains were over $26,000 in 2020, bringing the total average equity to more than $200,000 per homeowner. While equity gains have varied significantly across the nation, in general, the availability of home equity has been the principal form of savings and household wealth for low- to moderate-income homeowners. In particular, home equity can serve as a critical financial buffer in times of economic uncertainty, such as what we experienced during the pandemic. Indeed, homeownership is a key method of accruing wealth, so differences in the attainability of homeownership directly result in differences in wealth.
Among the many afteraffects of The Great Reshuffling has been a shift in the drivers of online real estate success. Our CE Web data track these drivers for the instant buying businesses of Offerpad, Opendoor, and Zillow, and shows how the companies are adjusting to declining listings. In today’s Insight Flash, we evaluate what is happening for each in terms of ASP Growth and the ratio of homes sold to homes acquired, as well as which states are more exposed to homeowners versus renters. Since the beginning of the year, Opendoor’s Average Selling Price (ASP) growth has consistently outperformed Zillow’s. Opendoor’s ASP growth has trended within a 13-27% band since mid-January, while Zillow’s has been about 5% lower in an 8-22% range.
For the last five years, millennials have made up the largest share of home purchase mortgage applications. This demographic tailwind comprises the largest generation of households who are approaching their first-time homebuying years. Older millennials, meanwhile, are in the age-range for a move-up purchase. According to the CoreLogic Loan Application Database, prior to 2020, while millennial home purchase applications comprised less than half of all purchase applications, their share grew from 33% in 2014 to 47% in 2019, rising about 2 to 4 percentage points per year. This annual increase is consistent with the cohort of millennials reaching 33 years of age, the peak homebuying age.
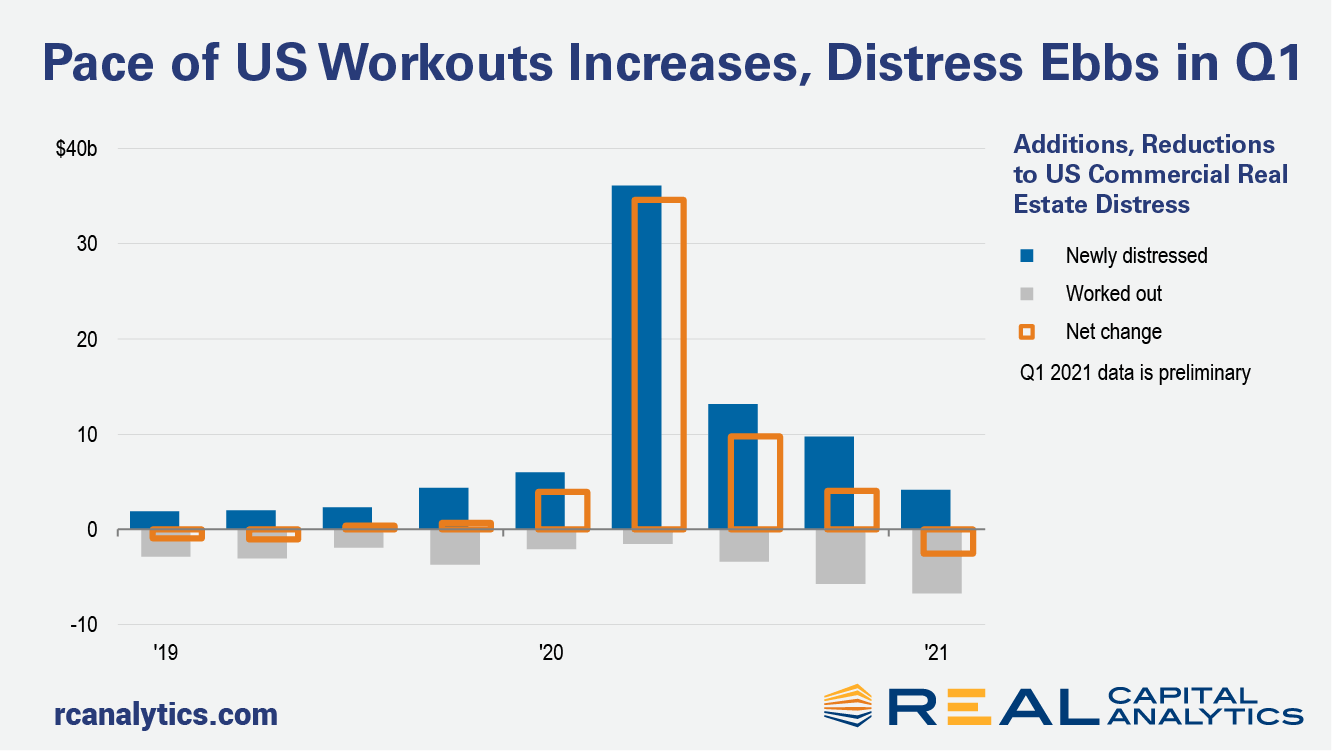
More U.S. commercial real estate distress was worked out than arose in the first quarter of 2021, preliminary Real Capital Analytics data shows. All other things being equal, this change in behavior would be an important sign of a transition in the marketplace. We are not finished with all aspects of distress, however. There is a looming supply of potentially distressed loans that still may have an impact. The pace of workouts will play an important role in the process of price discovery for commercial properties. Deal volume has contracted sharply over the last year as owners and potential buyers disagree on how assets should be priced. To the extent that there are more loan workouts, information from these negotiations will adjust buyer and seller expectations on prices that can be achieved.
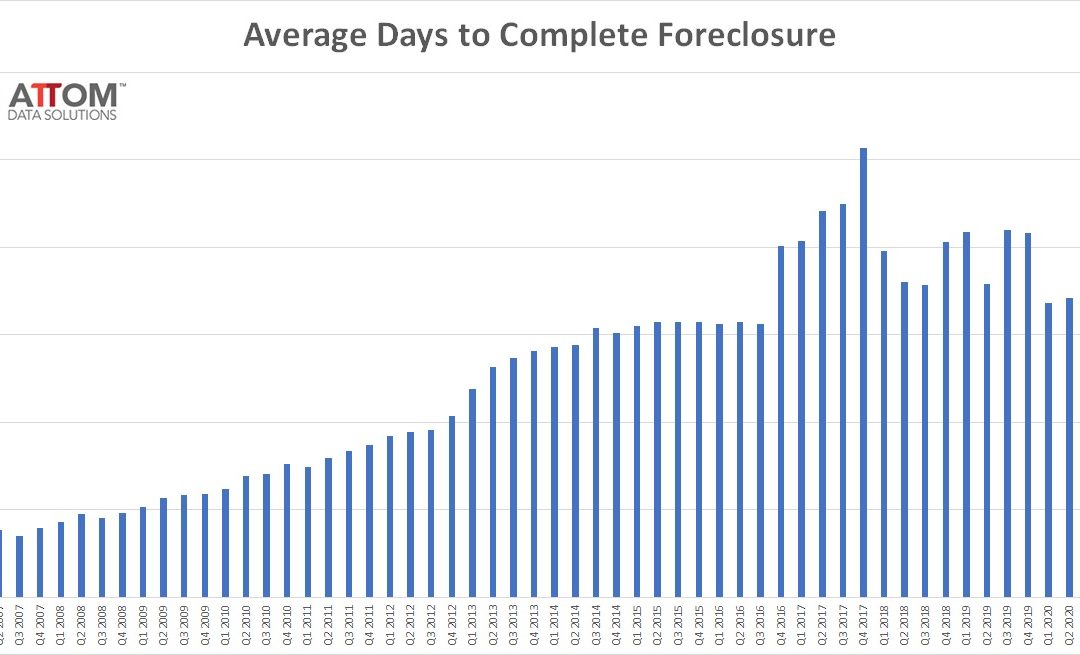
ATTOM Data Solutions, licensor of the nation’s most comprehensive foreclosure data and parent company to RealtyTrac (www.realtytrac.com), today released its Q1 2021 U.S. Foreclosure Market Report, which shows there were a total of 33,699 U.S. properties with foreclosure filings — default notices, scheduled auctions or bank repossessions — during the first quarter of 2021, up 9 percent from the previous quarter but down 78 percent from a year ago. The report also shows a total of 11,880 U.S. properties with foreclosure filings in March 2021, up 5 percent from the previous month but down 75 percent from March 2020 — the second consecutive month with month-over-month increases in U.S. foreclosure activity.
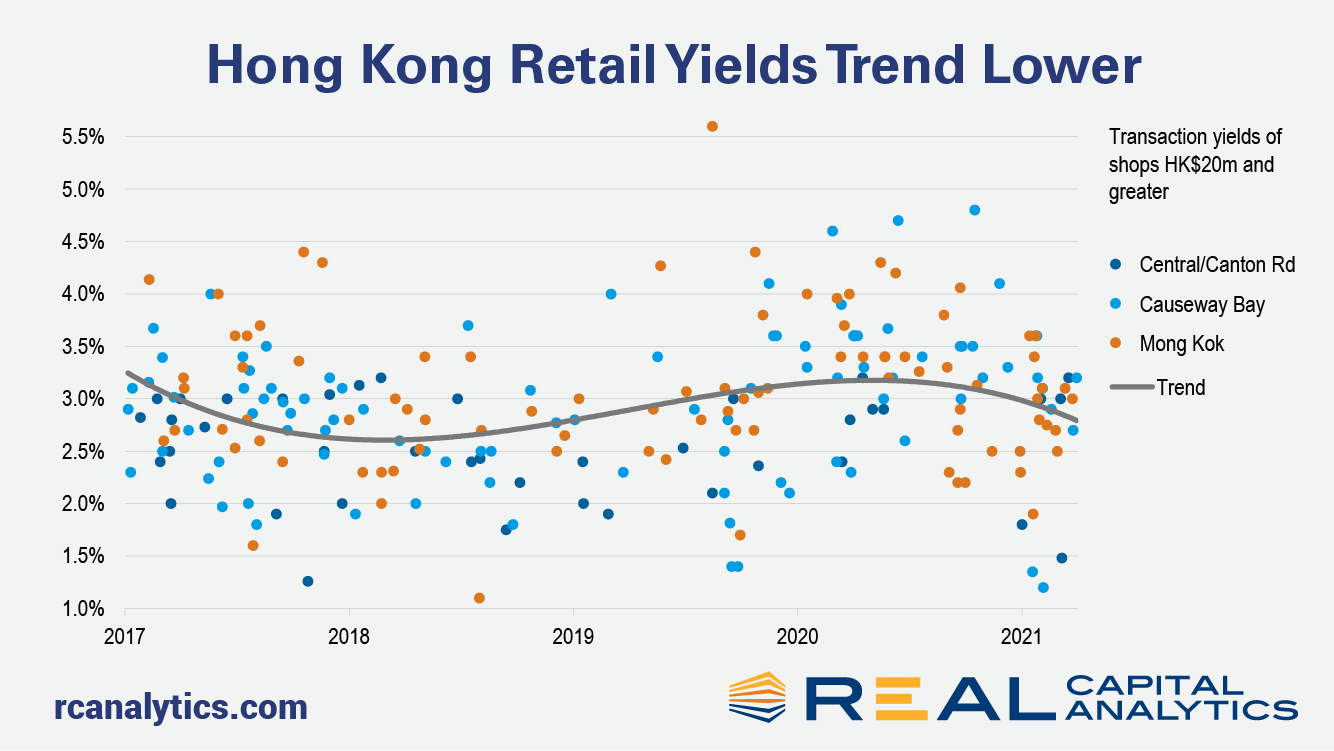
Landlords of shops in Hong Kong have had a rough ride over the past two years. The political unrest in the middle of 2019 had already exacted a heavy toll on retailers, with businesses disrupted by the clashes and overseas visitors unnerved. (This author too put his own family’s vacation plans on ice.) Then tourist numbers all but evaporated with the onset of Covid-19 less than a year later. Resultantly, prices of CBD shops plummeted, as average quarterly yields headed upwards by 100 basis points between the middle of 2018 and the second quarter of 2020. (This analysis is based on retail assets trading at a value of HK$20 million — $2.5 million — and greater.) Throughout the whole of 2020, no shop assets traded at a sub-2% yield, according to Real Capital Analytics records. The last time the yield floor for such assets was this high was in 2008.
In January 2021, 5.6% of home mortgages were in some stage of delinquency (30 days or more past due, including those in foreclosure)\[1\], a small decrease from December 2020, and the fifth consecutive monthly decrease. While this is good news, the overall delinquency rate remained high and was 2.1 percentage points above the year ago level, according to the latest CoreLogic Loan Performance Insights Report. The share of mortgages that were 30 to 59 days past due – considered early-stage delinquencies – was 1.3% in January 2021, down sharply from a post-pandemic high of 4.2% in April 2020 and the lowest rate recorded in at least 22 years.
Spring is here and the first quarter is behind us. It was around this time last year that the COVID-19 pandemic really began to significantly affect life and the economy with effects reverberating throughout the rest of 2020. A strong, though not ubiquitous, resurgence in apartment demand in the latter half of last year created a question for industry participants at the turn of the new year – to what extent would the multifamily recovery continue into 2021? At the national level, new construction activity continued at a feverish pace to the tune of more than 96,000 new units delivered in the quarter. This level of new supply outpaced that from the opening quarters of 2020 and 2019 by a significant margin. The 2021 deliveries equaled around 10,000 units more than in the opening quarter of 2020 and almost 25,000 units more than that portion of 2019.


