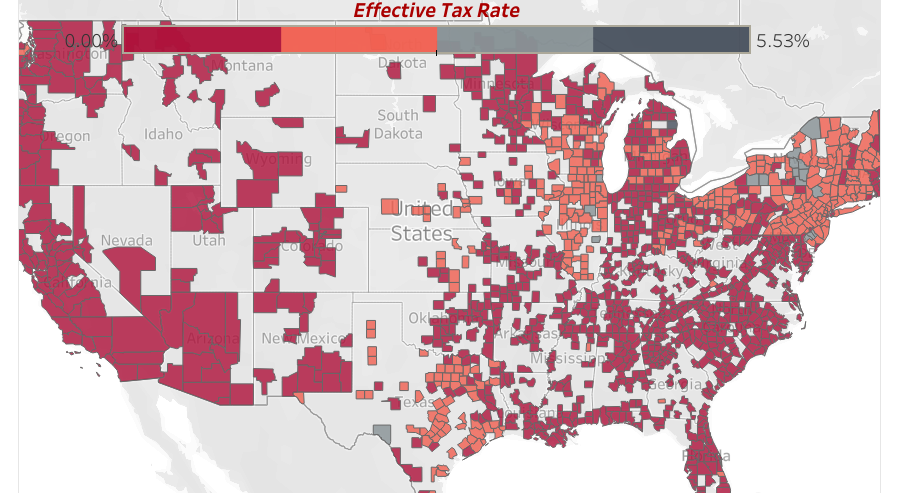
ATTOM Data Solutions, curator of the nation’s premier property database, today released its 2020 property tax analysis for almost 87 million U.S. single family homes, which shows that $323 billion in property taxes were levied on single-family homes in 2020, up 5.4 percent from $306.4 billion in 2019. The average tax on single-family homes in the U.S. in 2020 was $3,719 — resulting in an effective tax rate of 1.1 percent. The average property tax of $3,719 for a single-family home in 2020 was up 4.4 percent from $3,561 in 2019 while the effective property tax rate of 1.1 percent in 2020 was down slightly from 1.14 percent in 2019.
National home prices increased 10.4% year over year in February 2021, according to the latest CoreLogic Home Price Index (HPI®) Report. The February 2021 HPI gain was up from the February 2020 gain of 4.3% and was the highest year-over-year gain since April 2006. Low mortgage rates and low for-sale inventory drove the increase in home prices; however, affordability constraints may work to slow home price growth later this year, especially as mortgage rates increase.
Despite many accounts of an urban exodus, the COVID-19 pandemic will not leave American cities hollow. Throughout the pandemic search activity has turned towards large, dense cities, not away from them. For every renter who left, there appear to be many ready to take their spot. Compared to this time last year (i.e., pre-pandemic), the data show more search activity directed towards higher-density cities and towards the principal cities that anchor each major metropolitan area. Simultaneously, increased demand for short-term leases indicate that pandemic-era moves are less permanent than those of previous years.
Distress has been the watchword for capital raising in recent months as investors eye assets under pressure because of Covid-19 challenges. As yet though, troubled assets have not translated through to a spike in distressed asset sales. As shown in the chart, so far only the hotel sector has seen a notable surge in distressed sales as a percentage of the sector volume. Between March of 2020 and February of 2021, 8% of hotel sales involved a distressed asset. However, the total level of hotel transaction activity was scant during that time frame: only $10.6 billion of hotels traded, as compared to $36.6 billion in the prior 12-month period.
ATTOM Data Solutions’ new Q1 2021 U.S. Home Affordability Report shows that median home prices of single-family homes and condos in Q1 2021 were more affordable than historical averages in 52 percent of the counties analyzed. That figure was down from 63 percent in Q1 2020 and 95 percent in Q1 2016. The latest home affordability analysis conducted by ATTOM, reported that with workplace pay rising and home mortgage rates continuing to hit historic lows, major expenses on a median-priced home nationwide still consumed just 23.7 percent of the average wage across the country in Q1 2021. That figure was up from 22 percent in Q1 2020 and 19.7 percent in Q1 2016. However, the report noted that figure remained well within the 28 percent standard lenders prefer for how much homeowners should spend on those major expenses.
Robust home price growth, which averaged 5.7% nationally over the last year according to the CoreLogic Home Price Index , drove equity of America’s homeowners with a mortgage up by more than $1.5 trillion. Added together across all homeowners in the U.S., home equity has grown more than $12 trillion since its low point during the Great Recession. This is good news for homeowners —but the situation is a little trickier when it comes to how that $12 trillion is spread, and which of those homeowners are currently in a stage of forbearance. For families who have a low amount of equity and are in forbearance, the risk of losing their home becomes higher.
This month’s data shows rent prices continuing to rebound in markets across the country. Our national index increased by 1.1 percent over the past month, the largest monthly increase ever in our estimates, going back to the beginning of 2017. The data continue to exhibit significant regional variation, but the days of plummeting rents in pricey coastal markets appear to be over. Although rents in San Francisco are still down 23.2 percent year-over-year, the city saw an increase of 3.4 percent this month, the biggest increase among the 100 largest cities in the country. 9 of the 10 cities with the sharpest year-over-year declines have now had two consecutive months of rising rents. At the other end of the spectrum, many of the mid-sized markets that have seen rents grow rapidly through the pandemic are showing that there’s still steam left in the current boom -- Boise rents also jumped by 3.4 percent this month, and are now up by 16.1 percent year-over-year.
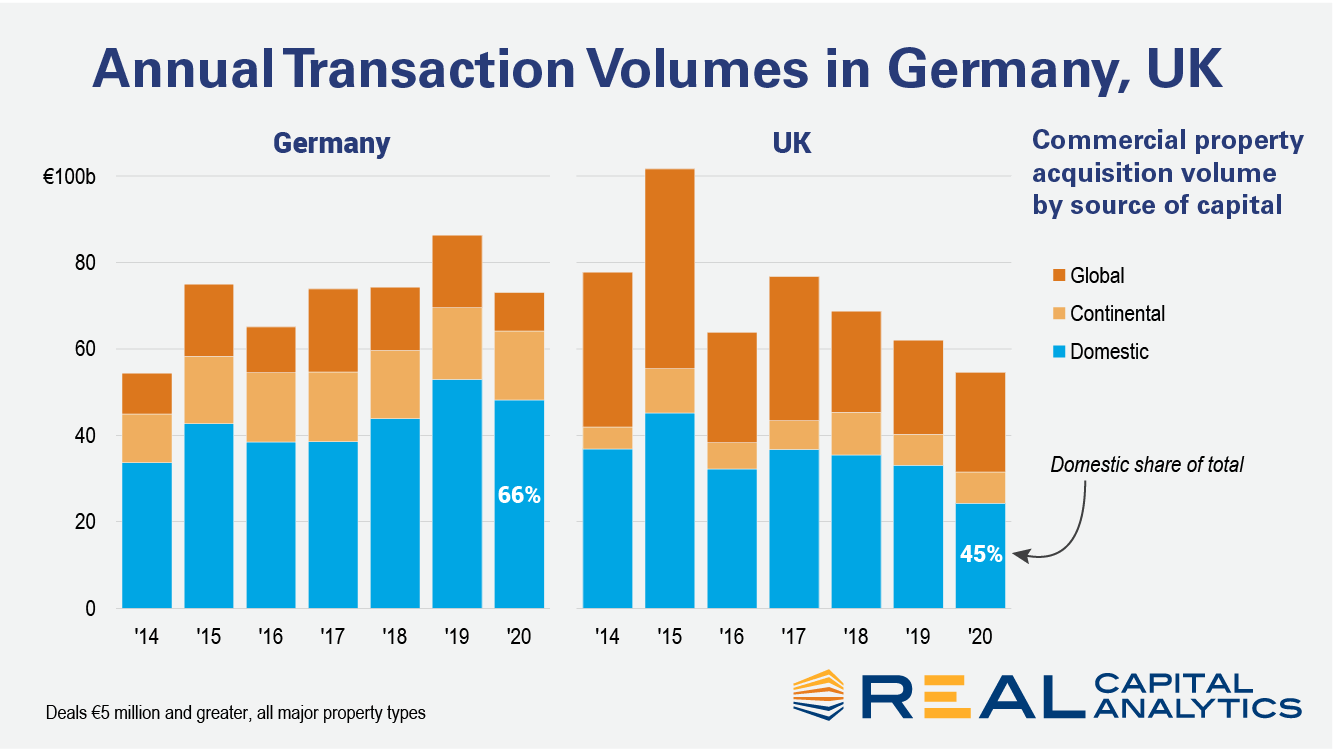
Since the end of 2015 Germany has attracted more investment capital than any other European commercial property market. Real Capital Analytics has recorded transactions totaling €372 billion ($438 billion) in the last five years, €47 billion more than in the U.K., the second most active market. One of the explanations offered for this rise to prominence is the U.K.’s June 2016 decision to leave the European Union, subsequent to which, Germany has been labelled as Europe’s new safe haven and a home for capital that might previously have gone elsewhere.
Recent announcements of forbearance extension by the Federal Housing Finance Agency (FHFA) came on the heels of millions of forbearance plans that are about to expire at the end of March under the CARES Act. The new extensions allow an additional six months’ stay in forbearance, making borrowers eligible for a total of 18 months of temporary payment relief. The latest loan performance data from CoreLogic reveals that 75% of the pandemic forbearance-loan pool consists of loans in forbearance since April.
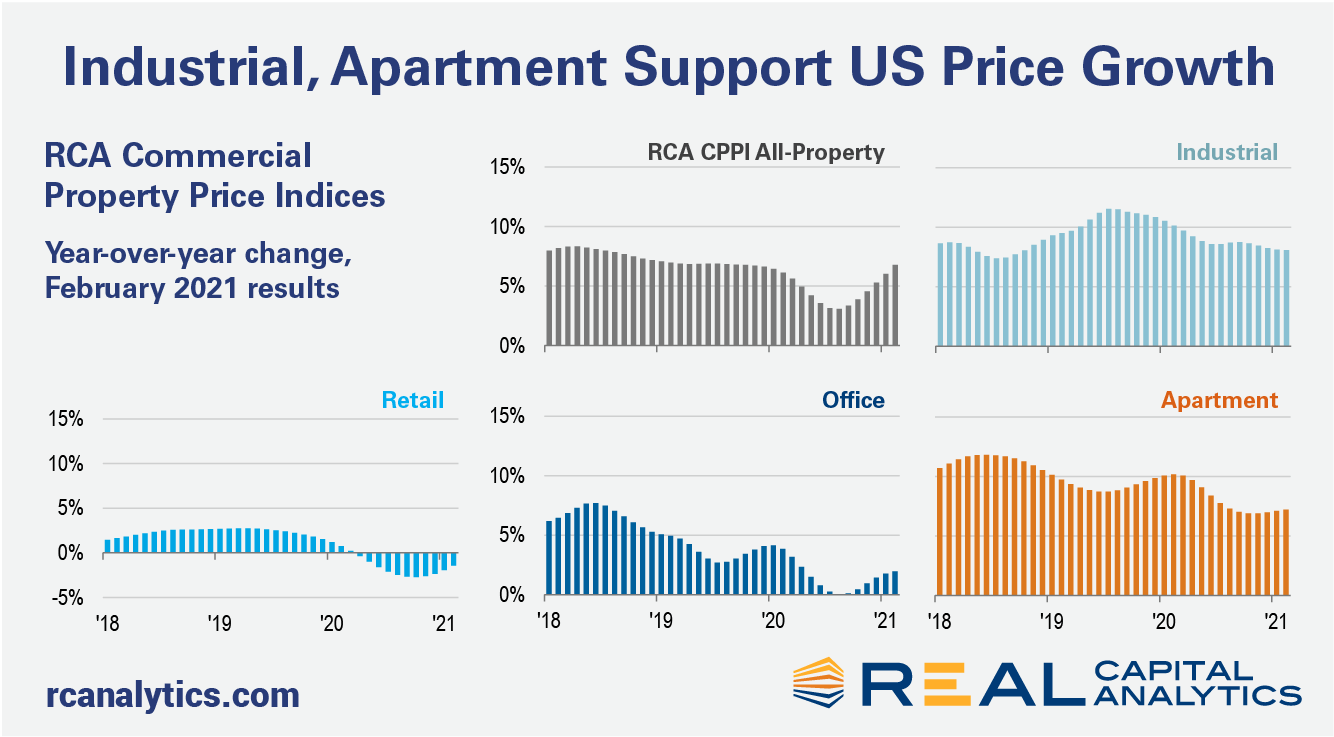
The annual pace of U.S. commercial property price growth reached 6.8% in February, a rate comparable to the months preceding the country’s initial coronavirus lockdowns, the latest RCA CPPI: US summary report shows. The US National All-Property Index rose 0.9% in February from January. The office index increased 2.0% year-over-year in February. Prices in the office market have slowly crept back from the middle of last year when the index was flat, but are still only increasing at half the rate seen a year ago. Suburban office prices kept the office index afloat last month, gaining 2.2% year-over-year.
The housing market, like many segments of the economy, had a unique year in 2020. Pandemic-induced demand – for homes with more living space and located in lower density neighborhoods -- coupled with historically favorable mortgage rates and declining for-sale inventories led to the most competitive market seen since at least 2008. Buyers competing for fewer properties on the market were generally willing to offer relatively more than they have been in recent years, leading to the ratio of closing price to listing price reaching the highest level since at least 2008.
ATTOM Data Solutions, curator of the nation’s premier property database, today released its Q1 2021 Single Family Rental Market report, which ranks the best U.S. markets for buying single-family rental properties in 2021. The report analyzed single family rental returns in 495 U.S. counties, each with a population of at least 100,000 and sufficient rental and home price data. The average annual gross rental yield (annualized gross rent income divided by median purchase price of single-family homes) among the 495 counties is 7.7 percent for 2021, down from an average of 8.4 percent in 2020. Within that group of counties, the yield declined from 2020 to 2021 in 87 percent of counties. However, it’s not all bad news for rental property investors.
In spite of the confluence of the COVID-19 pandemic and high unemployment in 2020, the total number of home-purchase loan applications rose by 11% from 2019. The need for more space (to accommodate an office or school room from home), reduced need to commute and record-low mortgage interest rates influenced strong buyer demand and may have offered an opportunity to relocate to more affordable areas. According to CoreLogic data, homebuyers relocating to another metro were often choosing metros that are either adjacent to their current location, had a lower cost of living, or both.
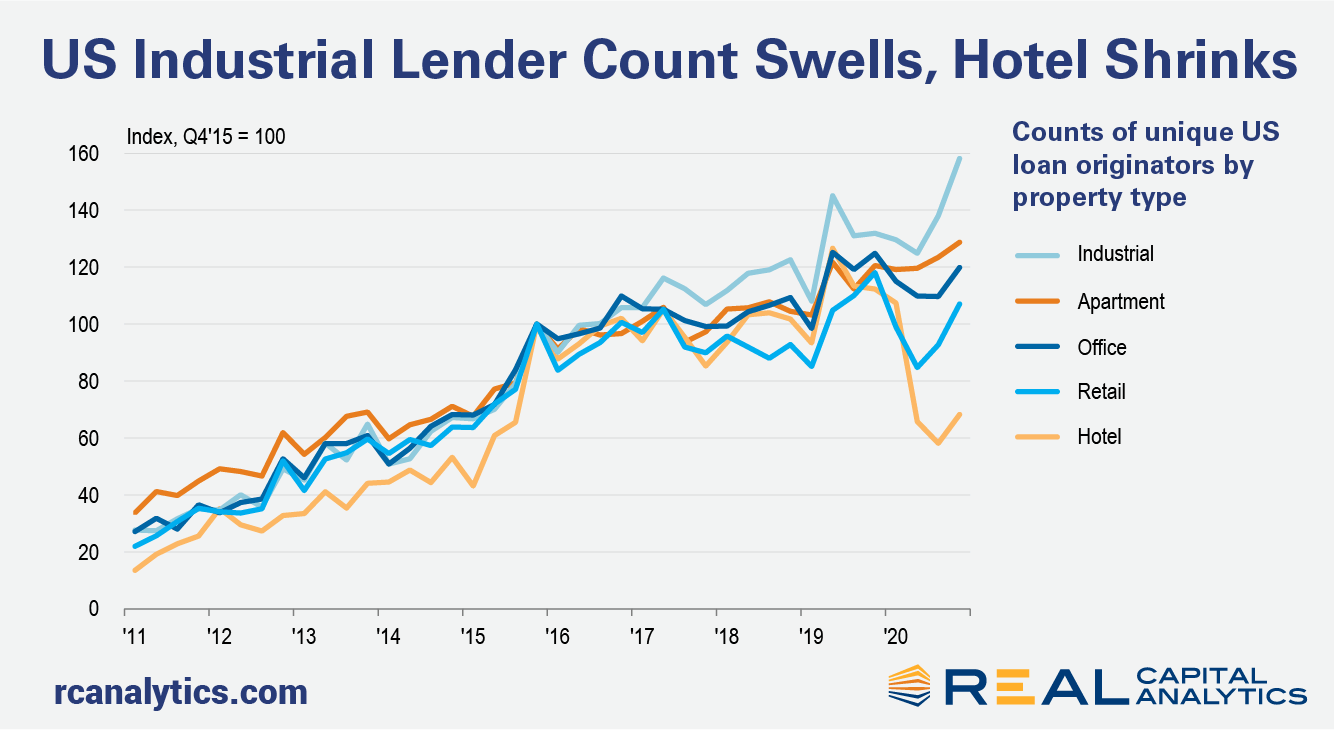
One year into the pandemic and clearly the current market downturn is not like the last one just over a decade ago. Commercial property prices have not been the adjustment mechanism for the disruptions from the pandemic — deal volume has suffered instead. A functioning debt market with far higher levels of liquidity than in the last crisis is a big part of the difference between these recessions. Liquidity is not just a story about volume. To measure trends in liquidity in the equity portion of the capital stack, Real Capital Analytics publishes a composite scoring system looking at numerous indicators that can influence a market.
Historically, when it comes to recessions, home prices don’t always dovetail with economic instability. In fact, home sales numbers have a much tighter relationship with recessions. The current recession is unique, however, and that uniqueness can be seen in the behavior of the national housing market.
U.S. single-family rent growth remained strong in January 2021, increasing 3.8% year over year, showing solid improvement from the low of 1.4% reported for June 2020, and up from the 2.9% rate recorded for January 2020, according to the CoreLogic Single-Family Rent Index (SFRI). The index measures rent changes among single-family rental homes, including condominiums, using a repeat-rent analysis to measure the same rental properties over time.
After a rough second quarter in 2020 when the multifamily industry was dealing with the full impact of the COVID-19 pandemic, national apartment demand rebounded strongly in the second half of the year. It was this resurgence, above and beyond demand seen in the same portion of 2019, that buoyed overall annual performance numbers and prevented dramatic declines in average occupancy and rent. This positive momentum has carried over into the new year so far with net absorption in both January and February surpassing the same months last year.
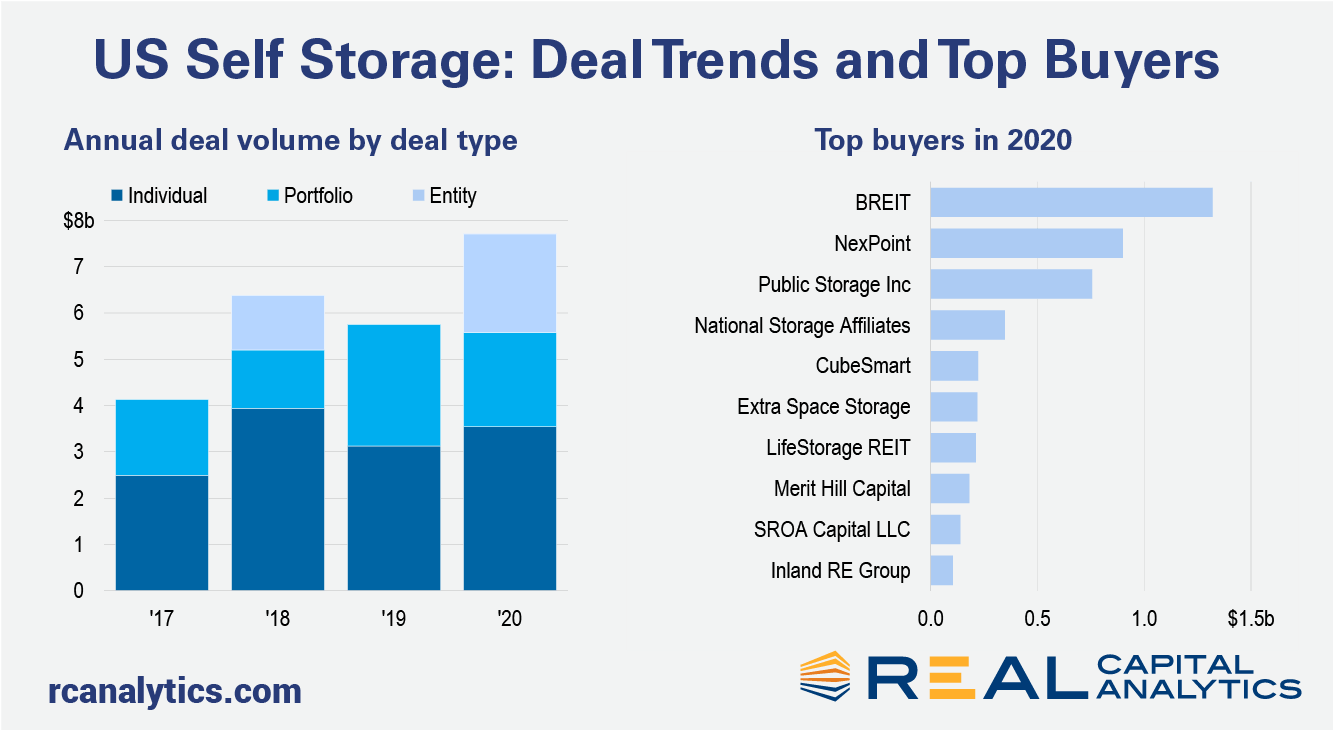
Transactions involving U.S. self storage assets reached a record level in 2020 despite the disruption and uncertainties caused by the global pandemic. While two outsized entity-level deals boosted transaction volume, individual deals and a wide range of buyers are evidence of ongoing broad interest in the sector. At $7.7 billion for the year, self storage deal activity was one-third higher than that of 2019, a stark outperformance compared to the U.S. market overall which slumped by more than a quarter.
In January 2020, mortgage delinquencies were at a generational low. After the pandemic hit, many families, especially those working in service occupations that entail in-person contact, faced a large income shock through job loss, illness, or death of a family member. Places that were hardest hit by job loss saw the biggest spikes in past-due loans over the last year. Nationwide, the CoreLogic Loan Performance Indicators reported past-due rates up by 2 percentage points last year. In Hawaii and Nevada past-due rates jumped 4 percentage points.
The amount of equity in mortgaged real estate increased by $1.5 trillion in 2020, an annual increase of 16.2%, according to the latest CoreLogic Equity Report. The average annual gain in equity was $26,300 per homeowner -- the largest average equity gain since the third quarter of 2013. The nationwide negative equity share for the fourth quarter of 2020 was 2.8% of all homes with a mortgage, the lowest share of homes with negative equity since CoreLogic started tracking this number in the third quarter of 2009.


