Ryanair is now the fifth largest airline in the world (in terms of capacity) and returned to profitability in the second quarter of 2022, making it the most successful of the three largest European low-cost carriers. Drawing on OAG data for airline capacity and flight cancellations, as well as information published in airline financial statements for the period April to June 2022, we compare Ryanair with easyJet and Wizz Air on some key metrics to understand what is behind Ryanair’s success.
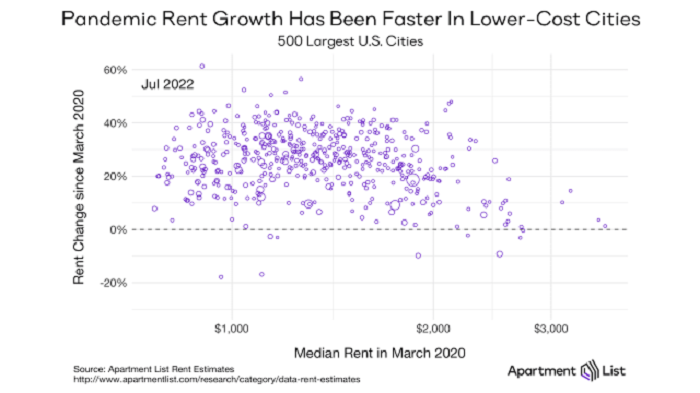
Since 2020, rent growth in the United States can be broken into two phases. The first started with the COVID-19 pandemic in March 2020 and lasted roughly one year. During this time, expensive cities - particularly denser metropolitan ones - experienced a surge in vacant apartments and a sustained drop in rent prices. Meanwhile, in cheaper and more-suburban cities, rent drops were short-lived and price growth accelerated within months. We witnessed a steady price convergence, as expensive cities got cheaper and cheaper cities got more expensive.
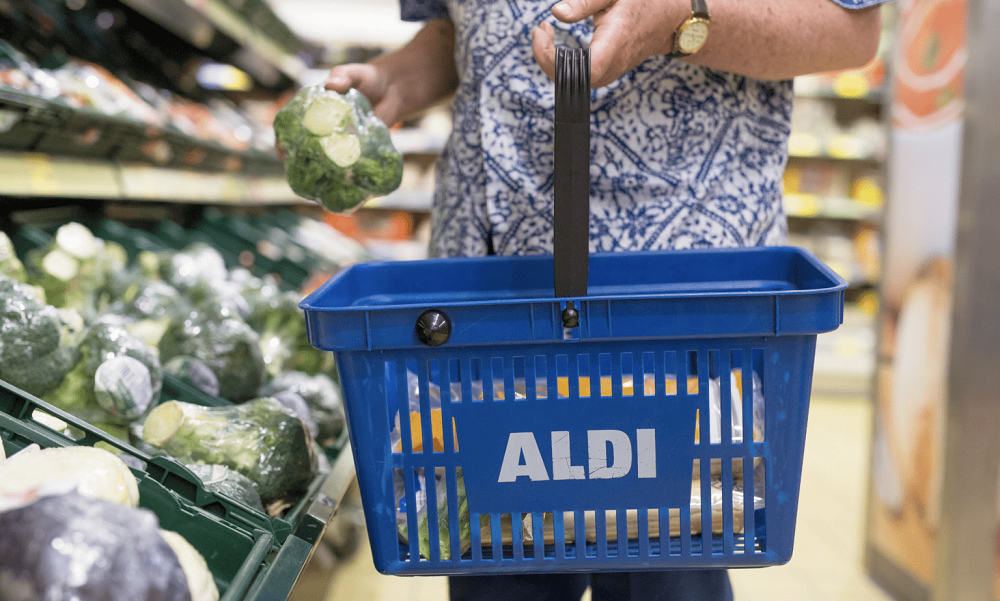
In July 2022, the grocery industry reportedly experienced the biggest year-over-year price hikes since the 1970s, affected by factors such as inflation and ongoing supply chain issues. So how has consumer spending at specific supermarket chains fared against this backdrop? Using consumer transaction data, we analyzed how U.S. consumer spending at major grocery store companies—including Ahold Delhaize; Albertsons Companies, Inc (NYSE: ACI); Aldi; H-E-B; The Kroger Company (NYSE: KR); Publix; and Trader Joe’s—changed between July 2021 and July 2022.
As consumers look to maximize their spending power amidst record inflation, discount stores have become increasingly attractive to bargain shoppers. Dollar General has long been synonymous with dollar stores, and in recent years, the chain has charted a course to expand beyond the dollar store category and into the discount grocery and home goods spaces. We dove into the foot traffic data to explore how Dollar General is cementing itself as a true one-stop shop for the value-oriented consumer.
Latin America, home to some of the most urbanized cities in the world, is one of the fastest growth spots for ride-hailing. Traffic congestion, limited public transport infrastructure make it difficult to cope with peak demand during morning commute times in large cities like Sao Paulo, Mexico City and Bogota. Amidst the intense rivalry amongst ride hailing companies in Latin America, Measurable AI’s transactional e-receipt panel reveals that Uber and 99 (owned by Chinese ride-hailing company Didi Chuxing) are the major rivals in these two markets.
As y/y inflation in the UK continues to create woes for shoppers, which businesses are suffering as well? In today’s Insight Flash, we dig into not only where average ticket has increased the most, but also look at which subindustries might be seeing the impact of trade up/trade down. Since the beginning of the year, the largest changes in average ticket have been concentrated in travel-related industries, likely partly due to longer trips during the holiday period but also partially driven by rising costs as demand and fuel prices make transport more expensive.
Multifamily rent growth has garnered plenty of attention over the last 12 or 18 months. For the majority of that time, the focus was on the unprecedented rate of the growth – at least in the modern era. Over the last month or so some of the conversation has shifted to discussing a slowdown in growth. The aim of this month’s newsletter will be to add some additional clarity and context to the discussion.
Universities play a significant role in shaping the skills of the local workforce. This week, we focus on the largest state universities and uncover their skill specialties. We also assess the role that state universities play in supplying the skills required in the local job market. The map below shows the skill specialty of the largest state university system by enrollment. For a skill to be a university system’s specialty, it has to be overrepresented in the profiles of graduates from the university system, relative to graduates from other universities.
With the most recent department store visit data, we dove into the impact of rightsizing measures and looked at the particularly strong foot traffic to higher-end chains to understand how the category is dealing with the current economic situation. Department stores had a rough start to the year due to the January Omicron wave. And although visits began picking up in February, March’s inflation and fuel price surge opened the year-over-three-year (Yo3Y) visit gaps again. Now, following a difficult May and June, the Yo3Y visit gaps began narrowing once more.
Total construction starts rose 48% in July to a seasonally adjusted annual rate of $1.36 trillion, according to Dodge Construction Network. This gain results from the start of three large manufacturing plants and two LNG export facilities. However, even without these projects, total construction starts would still have increased 7%. Nonresidential building starts rose 79% in July, and nonbuilding starts jumped 120%, conversely residential starts decreased 8%.
New homes have experienced the same record price appreciation that the overall market has seen in the past two years. In June, the annual appreciation for new home prices was 17%, which is only slightly below 20% for existing homes1. To develop a more complete picture of the overall market, we must also look at the number of sales — and those tell a different tale.
Off-price apparel was a pandemic winner, exhibiting remarkable imperviousness to some of the wider brick-and-mortar challenges. And now that the economic situation has shifted, off-price retailers remain an attractive option as consumers seek to refresh their wardrobes without breaking the bank. We took a look at the latest foot traffic data to understand how the combination of inflation, supply chain woes, and residual pandemic effects are continuing to drive visits to the sector.
CoreLogic©, a leading global property information, analytics and data-enabled solutions provider, today released its latest Single-Family Rent Index (SFRI), which analyzes single-family rent price changes nationally and across major metropolitan areas. Single-family rent prices remain elevated, up 13.4% from one year earlier, but have continued to relax compared with growth seen earlier this year. This deceleration could be partially due to worries over an impending economic slowdown, even though the job market added 528,000 positions in July, returning the employment rate to its level prior to the COVID-19 outbreak
Calm just announced it is laying off 20% of its staff. The top two meditation apps have had a steady downward trend for engagement metrics since January 2021. User sessions of Calm are down 26.4% YoY in July, and Headspace is down a whopping 60.3%. As you can see in the graphic below, Calm did get a bump at the beginning of the year when almost all health & fitness apps have their best few months, but it started to decline dramatically shortly after Memorial Day.
Wholesale clubs like Costco Wholesale, BJ’s Wholesale Club, and Sam’s Club were some of the big winners of the pandemic’s shift to mission-driven shopping, and that strength carried throughout 2021. Early 2022 data indicated that the category was undergoing a mild correction following the record-breaking foot traffic numbers of the previous year. But comparisons to pre-pandemic metrics showed wholesale remaining strong despite the rise in inflation and gas prices. Now, as retail visitors continue tightening their budgets in the face of high consumer prices, we checked in to understand how the economic headwinds are impacting the three wholesale giants.
There are some interesting movements in the weekly capacity update from OAG, even though global airline capacity looks to be as stuck as the Manchester United back four! Weekly airline capacity is still at 102.4 million seats with 79,000 seats lost week-on-week, but dramatically Western Europe is now the largest regional market overtaking North America and holding first place in the global rankings. This is an “enjoy it while you can” moment for Western Europe as this is a function of the different school holiday seasons in each market and come September normal service will be resumed.
In last week’s earnings report, DIN reported rising sales at Applebee’s and IHOP among High Income shoppers making over $75,000 per year. They hypothesized that this was the result of those shoppers trading down from more expensive dining destinations as year-over-year inflation pressures continue. In today’s Insight Flash, we take advantage of our demographic data to see how high-income individuals have altered their spending in recent months. We look at overall spending by income group, deep dive into the restaurant sector, and examine changes in average ticket across subindustries for high income shoppers.
The top 10 quick-service restaurant apps in the U.S. were downloaded 12.1 million times in July, 16.3 percent more than those the month prior. Year-over-year in the month of July, downloads of the top 36 quick-service restaurant apps are up 42.2 percent. A download represents a new user and the first conversion on the mobile app customer’s journey.
Don’t let the recent job growth fool you—the US job market is a dumpster fire. In 2020, the unemployment rate reached 14.7%, the highest since The Great Depression. To add fuel to the fire, many people who received pink slips remained unemployed for more than a year. While the pandemic forced many cash-strapped companies to cut ties with people out of necessity, a lot of people left on their own accord. Enter the Great Resignation, the name used to describe the mass exodus of people quitting their jobs due to dissatisfaction related to pay, growth opportunities, benefits and more.
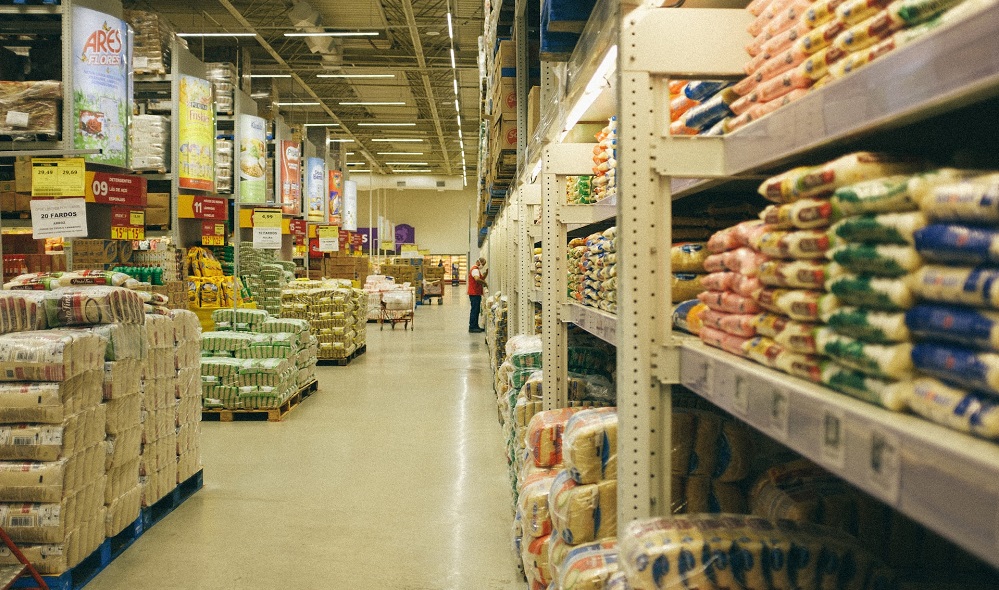
Earnest data exhibited supermarket spending growth of 5.3% YoY in July, boosted by 7.1% growth in average ticket, offset by a 1.7% decrease in the number of transactions. Ticket growth was yet another acceleration from the 6.2% YoY growth in June; similarly, the transaction decline was another slowdown from -0.9% in June. With price levels on the grocery shelf not seen since March 1979 (Food at Home prices increased 13.1% in July, up from 12.2% in June according to the latest BLS figures) forcing some to trade down into value-oriented items, shoppers may find a better deal by switching to more budget-friendly grocers


