When we last looked at the coffee segment, several of the biggest players were seeing significant visit boosts driven by their seasonal drink releases. As the holiday season approaches, we checked in again to see how these java giants are faring. Starbucks, the largest coffee chain in the country with almost 16,00 locations, outperformed the wider coffee segment in a challenging economic period. The weeks of October 10th and 17th saw year-over-year (YoY) foot traffic down 7.6% and 8.1%, as the challenging economic context and comparisons to a uniquely successful 2021 limited this year’s visit peaks.
Whether it’s a meal for one or a pie to share, pizza is a staple of the restaurant landscape. We dove into the visit data for four restaurant chains doing exciting things in the pizza category – Taco Bell, Papa John’s Pizza, Pizza Hut, and Pizza Inn – and took a closer look at changes that are driving visits. While the visit metrics don’t fully capture drive-thru, takeaway, or deliveries, the data can still provide a sense of visitation trends in the pizza space.
It’s been a minute (more specifically, a year) since Netflix made its foray into free mobile games, whose purpose was to increase the retention of its subscriber base. The streaming giant has launched and/or acquired 35 mobile games to date, for a total of 34.1 million global downloads, 16% of which come from the United States, its leading market.
“Obviously, Peacock sucks.” That’s what one executive said about NBCUniversal’s (NBCU) take on streaming. On the surface, the statement seems harsh—after all, Peacock is growing. In August 2022, Peacock reached 28mm monthly active accounts (MAAs), putting it on track to reach its goal of 30mm to 35mm MAAs by 2024. By 2026, Peacock could reach 84mm MAAs, representing a 250% increase in users from 2022. So, what gives, and what does the contradiction mean for the future of Peacock advertising? Ad strategies from July 1, 2021, through June 30, 2022, tell that story.
With yesterday’s AAPL earnings report beating expectations, the iPhone maker seems to have weathered the storm battering other tech companies for now. In today’s Insight Flash, we demonstrate how the combination of our CE Transact and CE Receipt datasets could have provided early insight into iPhone 14 performance, giving a preread on preorders. CE Transact data is able to capture what US shoppers spend at the Apple Store both online and at the company’s brick-and-mortar locations.
As noted in our Domestic Migration Trends white paper, COVID strengthened, rather than upended, existing migration patterns. Many cities and states that were already attracting new residents before the pandemic saw their inbound migration pick up pace, while some areas where the population was stagnant or declining before COVID saw these negative trends accelerate as well.
The effects of inflation are omnipresent. The mobile app market isn’t immune to them, and has, in fact, begun to show signs that the economic headwinds facing the business macrocosm are filtering down to the mobile microcosm, affecting publishers and apps of all sizes. Without a clear end in sight, this environment demands that those evaluating opportunities in the mobile ecosystem have a sustainable approach to surface insights around its most resilient aspects. In our State of Mobile Apps During an Economic Downturn report, data.ai reveals how mobile performance data can illuminate a brighter path through these turbulent times for app makers.
Welcome to the quarter final of the Japan Food Delivery Race in 2022. A lot has happened in the first half of this year: In January, Foodpanda divested its Japanese business and in May, DidiFood left, followed by Rakuten Delivery who paused its delivery service in July. After two years of competition, the final teams are now: UberEats, Demae-can, Doordash, Wolt, and Menu.
STR’s U.S. “bubble” chart update for mid-October 2022 highlights the best and worst performing hotel markets in terms of occupancy, the average percentage of rooms being filled. Data for the four weeks ending 15 October shows that New York City widened its performance lead over the other large markets and that leisure travelers flocked to autumn destinations as well as resorts far removed from the path of the hurricane. Among the Top 25 Markets, New York City had the highest occupancy at 84.7%. Boston (81.6%) was second, while Anaheim (80.7%), Nashville (79.3%) and San Diego (79.1%) rounded out the top five.
PICO4 struck a balance between quality user experience and friendly pricing as an All-In-One VR targeted towards the mass market. Its wearing experience, screen display, optical scheme, spatial orientation, and system interaction experience significantly improved compared to past generations. Its fitness, video, entertainment, and content creation have gradually come into play as well. Most noteworthy, PICO4 set its price at a widely acceptable range at below the Chinese smart phone market average (3000RMB).
Employers are still facing one of the tightest labor markets in recent history. Amid labor shortages and the Great Resignation, one question remains key: How does a company attract high quality candidates? By looking into the number of applicants per job posting, we can gain insights into what drives applicants’ interest to apply. Linking the number of applicants with companies’ employee review scores and controlling for company and occupation effects, we can rank drivers of applicants-per-posting. Company culture is the leading driver of more applications to job postings.
When we last checked in with Texas Roadhouse, the steakhouse chain was performing admirably. The brand is still displaying elevated foot traffic levels at a time when many other restaurants are feeling the dual pinch of COVID aftershocks and inflation. Texas Roadhouse’s success is driven in part by its willingness to use technology to drive in-house dining, and recent foot traffic data confirms the strength of the company’s strategy.
Our last analysis of department stores highlighted the foot traffic potential for the space heading into the summer months. Now, with the holiday retail season already heating up, we dove into the visit data for department stores as well as upscale shopping corridors to take a closer look at this past summer’s foot traffic and the momentum being carried into the holiday season.
After two-plus years of a pandemic, a quick transition into a recession seems only fitting. Whether or not that’s true—the definition of a recession is widely disagreed upon—we can all agree that the economy is going through a rough patch. That means layoffs, revenue declines, go-to-market shifts, and less spending. When times get tough, and money is tight, ad budgets are typically one of the first line items to get the boot. But not all advertisers are watching their budgets disappear—some are spending more, despite the uncertain economy.
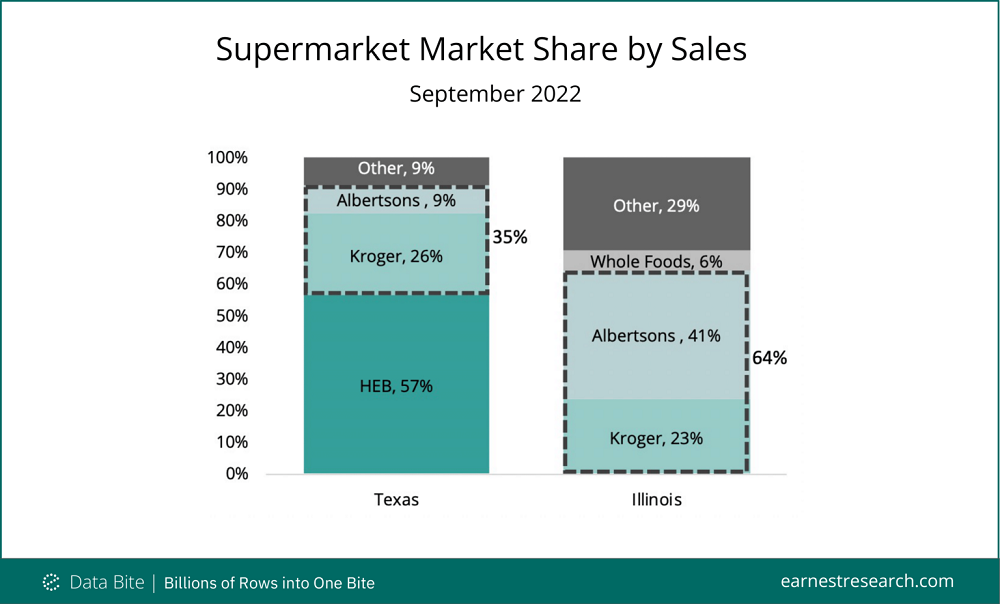
Albertson’s (ACI) short run as a public company may be coming to a close as it enters talks to merge with the nation’s second largest grocer and largest supermarket chain, Kroger (KR). However, the companies must first prove to regulators that their combined footprint is not a threat to a competitive economy. According to Earnest spend data, the biggest sales overlaps are in Texas and Illinois.
With Q3 2022 behind us, we took a closer look at two of the most well-known restaurant chains, McDonald’s and Chipotle, to see what their foot traffic patterns reveal about their current position within the wider food industry. McDonald’s is one of the most well-known food chains in the world, with nearly 40,000 locations worldwide, almost 14,000 of those within the U.S. The company is now planning to expand its store fleet for the first time in eight years.
Total construction starts decreased 19% in September to a seasonally adjusted annual rate of $1.02 trillion, according to Dodge Construction Network. In September, nonresidential building starts dropped 23%, residential starts fell 11%, and nonbuilding starts declined by 25%. Year-to-date, total construction was 16% higher in the first nine months of 2022 compared to the same period of 2021. Nonresidential building starts rose 37% over the year, residential starts were flat, and nonbuilding starts were up 20%.
With labor markets remaining tight, failing to cultivate a culture of internal hiring could cause companies to miss out on a goldmine of readily available talent. In previous research, we have found that lateral career opportunities are more than twice as important as compensation in predicting employee retention. In our latest article in MIT’s Sloan Management Review, co-authored with BCG Henderson Institute’s Nithya Vaduganathan and Colleen McDonald, we investigate the extent and impact of internal lateral hiring at large US companies.
Our latest white paper, the Q3 2022 Quarterly Index, looks at foot traffic patterns across key retail, dining, and service categories in Q3 2022. For each sector, we broke down weekly foot traffic data over the past quarter and identified several foot traffic leaders that represent the continued resilience of brick-and-mortar businesses over the past quarter. Below is a taste of our findings. For the full report, read the white paper.
You’ve come to rely on the Speedtest Global Index™ for our ranking of internet performance in countries around the world. Today we’ve expanded that resource to include internet speed rankings for some of the world’s largest cities. Read on to find out which city has the fastest download speed, learn how to find the information you’re looking for, and view a sneak peek at our 34 latest Ookla Market Reports™.


