Consumer transaction data reveals that sales for the home improvement industry skyrocketed early in the pandemic as many consumers stayed at home during shelter-in-place orders. A year and a half later, home improvement sales are still higher than pre-pandemic levels, but sales growth at a select group of major hardware store chains did not maintain the same momentum in 2021 as it did in 2020. At the same time, the average transaction value for home improvement companies has increased year-over-year.
Top tier malls across the country had been experiencing a steady recovery since the start of 2021. This recovery culminated in July when visits to indoor malls rose 1.0% above the same month in 2019, with outdoor mall visits rising 1.8%. Pent-up demand, a lack of travel, general excitement around the retail reopening and more all combined with the Back-to-School retail season to drive an impressive month.
The Dodge Momentum Index gained 11% in September to 164.9 (2000=100) from the revised August reading of 148.0. The Momentum Index, issued by Dodge Construction Network, is a monthly measure of the initial report for nonresidential building projects in planning, which have been shown to lead construction spending for nonresidential buildings by a full year. The commercial planning component increased by 13% in September, while the institutional component rose 8%.
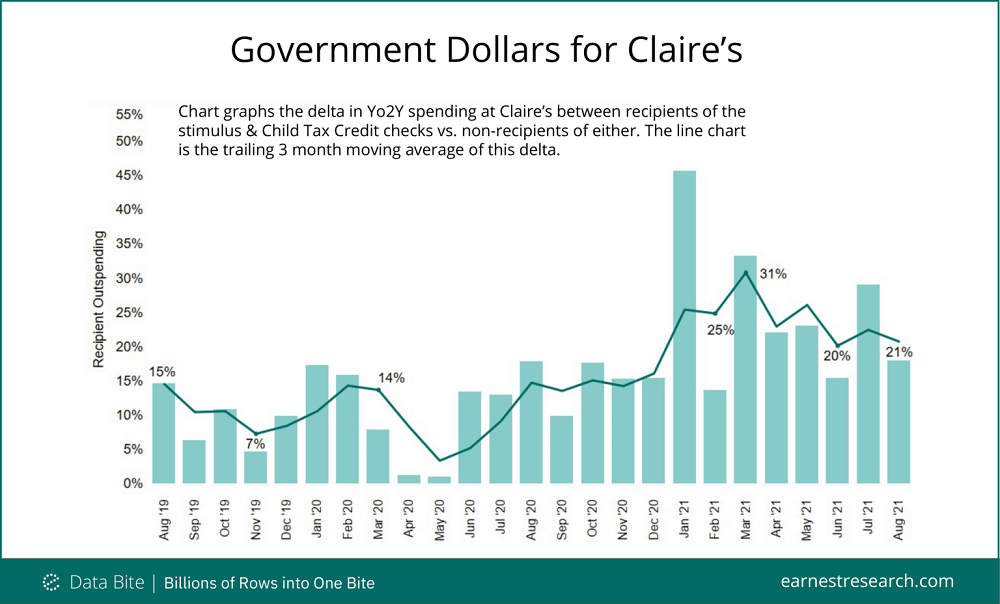
Teen/tween retailer Claire’s, known primarily for its fashion jewelry and ear piercing services, has filed for an IPO—several years after a private equity takeover and emergence from Chapter 11 bankruptcy. In its recent prospectus, Claire’s noted that for the first half of fiscal year 2021, North American sales grew 124.3% compared to 2020 and 23.2% compared to 2019; much of this was driven by ear piercing-related transactions.
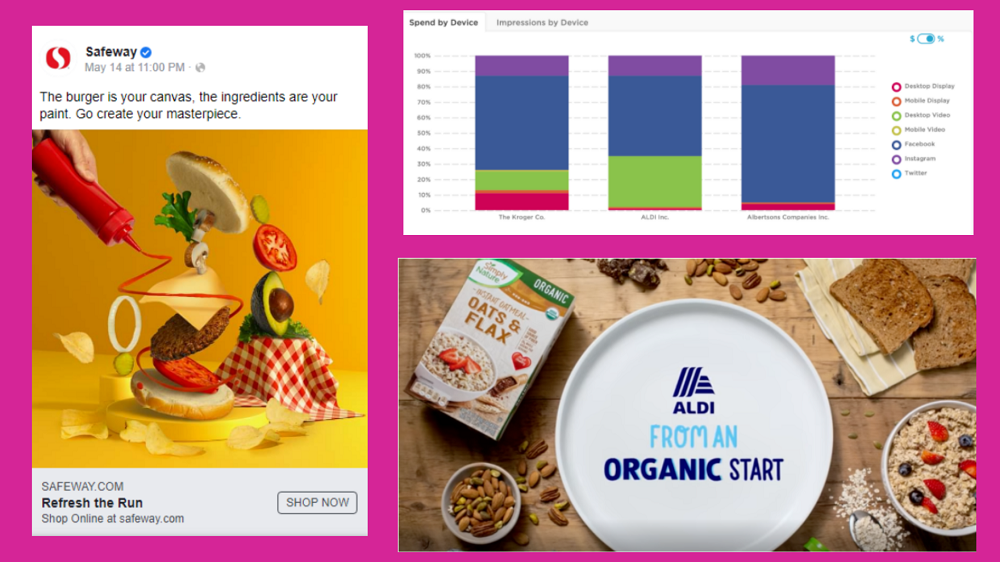
Today, 60% of U.S. consumers stock up on groceries online. In the wake of the pandemic, traditional grocers now compete with disruptors like Instacart and megaretailers like Walmart and Amazon. To help these retailers thrive in the cutthroat online grocery business, we use Similarweb Shopper and Research Intelligence, to compare Amazon, Walmart, Instacart, and traditional grocers. Web traffic to the U.S. grocery industry spiked 47% year-over-year (YoY) since the onset of COVID-19.
The retail and domestic tourism sectors are slowly seeing year-over-two-years visit gaps close in New York City, but major office towers are still seeing huge visit gaps when compared to 2019. And this has significant effects on restaurants and retail within the city. So we dove into the data to find out – how far along is the office recovery in NYC? Domestic tourism visits (visits by individuals living more than 50 miles outside of New York City) fell dramatically over the pandemic.
The pandemic has impacted the entire nation, but its influence greatly varies across state lines. Those living in California had a different experience than those living in Texas. And those living in New York had a different experience than those in Florida. Much of this has to do with public policy. Restrictions varied greatly among locations, leading to differences in regional ad sales. Due to the variations, we analyzed pandemic regional trends from four states—California, Texas, Florida, and New York—to help you with your regional sales strategies.
As formerly unknown TikTok influencers become bigger drivers of brand sales, do old school celebrities with careers in music and acting have as much sway? In today’s Insight Flash, we look into performance of celebrity brands in both the US and UK, seeing how spend and average ticket trend versus industry averages as well as what celebrity brand demographics are like in the US.
With the Back-to-School season in the rearview mirror and the holiday season quickly approaching, we dove into category level analysis to try and understand the wider trends impacting retail. The combination of the wider reopening alongside a key Back-to-School shopping season in the summer drove a significant recovery for many brands and segments. The overall retail category saw significant strength in the summer with the 7-week period beginning the week of July 5th showing average weekly visit growth of 7% when compared to the equivalent weeks in 2019.
Fable Data, the European transaction data platform based in London, has today released figures that show spending at UK petrol stations almost doubled during the peak of the crisis last Friday. Fable Data has analysed daily spending last week, using anonymised spend data from its panel of millions of consumers across Europe. Its analysis shows that the spike in UK fuel spending increased by 93% from last Friday compared with the average for the previous four weeks and remained elevated throughout the weekend.
On Tuesday September 28, 2021 Thor Industries, Inc. (THO) posted better-than-expected revenues of $3.59bn beating the consensus estimate of $3.3bn (-8%) and in the same direction as Advan's forecasted sales. The revenue was +54.6% YoY - Advan's foot traffic data captured an increase in employee foot traffic of +40% YoY at its manufacturing locations for Q4 fiscal 2021. As a result of beating the sales and EPS, the stock opened at $116.58, up +3.4% from its previous day's closing price and hit a high of $126.99 (+12.5%) shortly after the opening bell.
While the apparel sector as a whole is still struggling to consistently match or exceed its 2019 visit levels, major sporting goods stores are seeing their visits jump. We dove into the data to get a better understanding of this category’s impressive offline success. For the past five months, visits to four major sporting goods brands – Hibbett Sports, Dick’s Sporting Goods, Academy Sports + Outdoors, and Big 5 Sporting Goods – have consistently outpaced 2019 monthly visits.
Before the pandemic, it was typical for many of us to make several weekly runs to our neighborhood grocery stores so we could throw together a last-minute dinner. And if we were too tired to cook, dining in at our local restaurant would also work in a pinch. Since COVID-19 was declared a global pandemic, those carefree grocery habits and preferences have evolved for consumers around the country. Initially, customers embraced these new behaviors out of necessity. However, as the pandemic persisted, these new habits ended up sticking around as life adjusted around this new normal.
We are delighted to have sponsored today’s The Seaside and Coastal Regeneration Conference 2021, chaired by Professor Sheela Agarwal and featuring contributions from Sally-Ann Hart MP, Chair, All-Party Parliamentary Group on Coastal Communities. Our own Ben Ward-Cochrane, industry lead for Local Government presented original research contrasting seasonal coastal economies through footfall and catchment area analyses using mobility data from Community Vision
This year’s back-to-school season was different in a lot of ways for many children, but not much changed in retailers’ pursuit of their parents’ spend. In this week’s Insight Flash, we use our unique ability to cut our data by households with children to see where back-to-school growth was strongest. We examine average ticket growth by subindustry, changes in channel trends, and which brands are most exposed to households with children.
Labor Day marks the unofficial end to the summer travel season in the US, and 60% of Americans reported travel plans according to Cars.com, up 17% year over year. 9.2 million consumers hit the skies during the Labor Day holiday weekend, while cars.com reported more than 20% canceled flights and chose to drive amidst concerns over the delta variant. While global regions still face varying levels of pandemic safety regulations and Delta variant precautions, data shows travel and navigation apps surpassed 1.1 billion downloads from May to Aug 2021,
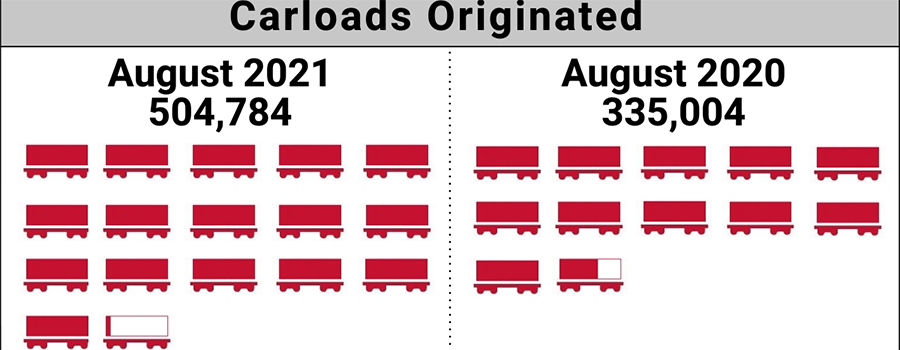
The number of carloads moved on short line and regional railroad in August 2021 was up compared to August 2020. Carloads originated increased 50.7 percent, from 335,004 in August 2020 to 504,784 in August 2021. Nonmetallic Minerals led gains with a 120.4 percent increase. Petroleum Products was up 106.5 percent, and Trailer and Container and Chemicals increased 100.8 and 82.0 percent, respectively. Grain led declines, down 11.2 percent. Motor Vehicles and Equipment was also down in August.
Prior to the pandemic, most consumers didn’t pay much attention to the names of big pharmaceutical companies. But now that public health has been on the forefront of our minds for more than a year and a half, we’ve moved from indifferent to engaged. Pharmaceutical companies are highly regulated but that didn’t stop them from spending [**$6.58 billion**](https://www.fiercepharma.com/special-report/top-10-ad-spenders-big-pharma-for-2020) on advertising last year across B2B and B2C sectors. Here’s a check-in of the latest trends and spending taking place in the pharmaceutical category.
The rapid development of the on-demand food delivery industry has transformed dining all over the world. Even cultures where dining at home is more the norm, they have succumbed to the convenience of ordering online from food delivery apps now. This can be seen even in countries like Japan, which remains one of the largest food delivery markets in the world but yet it still remains grossly underpenetrated relative to the size of the population and the size of the economy.
This week, we collaborated with Hedge Fund Alert to track hedge fund hiring trends as people return to offices. Our analysis shows that after a dip following the pandemic, hedge fund hiring rates in 2021 are greater than they have been in 8 years and are continuing to rise sharply. Looking at the headcount growth of certain roles in 2021 versus 2020, we see that there is a strong growth of senior roles with engineering and technical focus. Traditional banking roles, which are still strong in absolute numbers, are seeing a relative decline. This may be due to the industry’s growing focus on algorithmic trading.