Footfall across UK supermarkets has risen to 90% of pre-Covid levels in the last two weeks as Huq’s mobility data suggests that Brits have had more confidence to visit these outlets since the 4th July, which coincides with the date that hospitality and dine-in establishments were allowed to re-open.
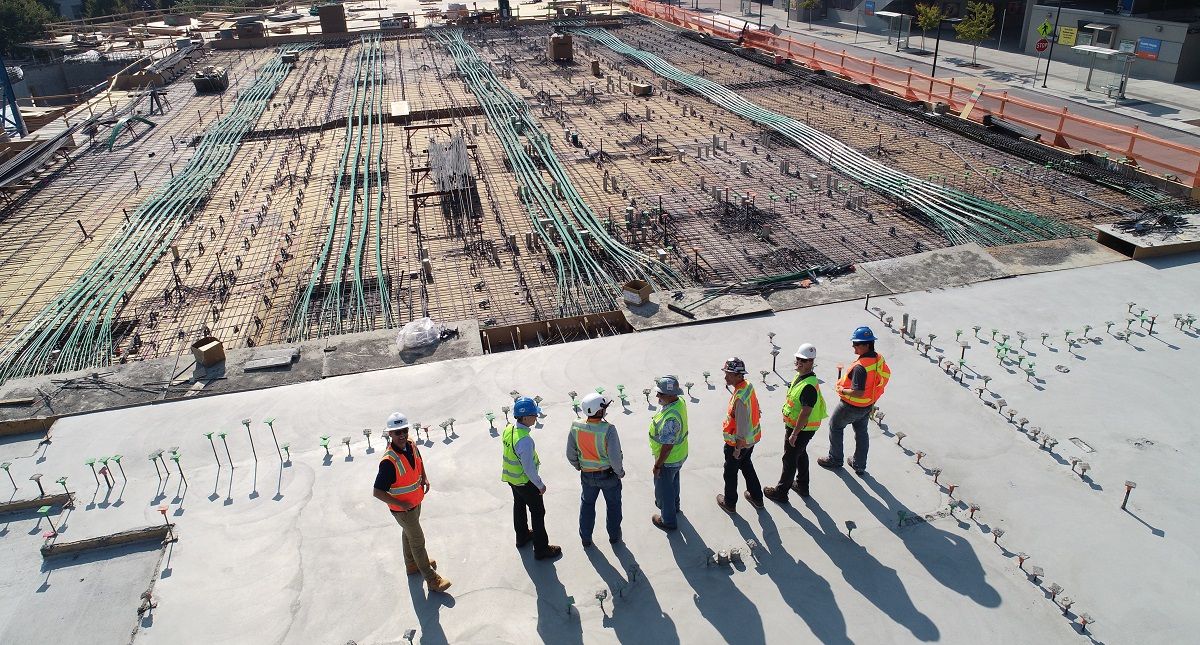
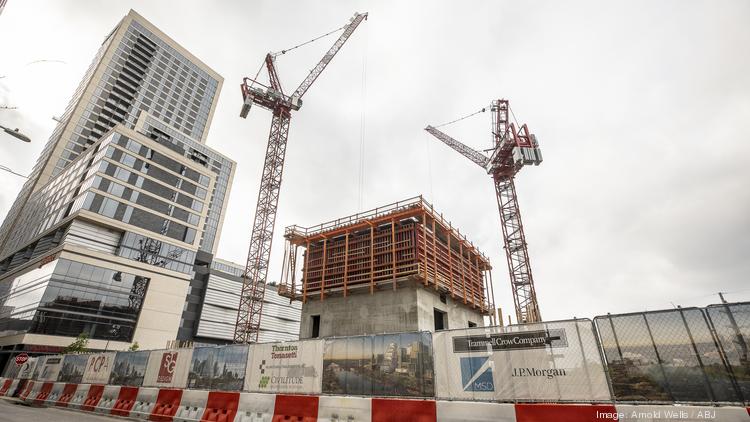
The COVID-19 pandemic and resulting recession have wreaked havoc on U.S. building markets. According to Dodge Data & Analytics, commercial and multifamily starts were quite healthy during January and February but stalled as the pandemic hit the nation in March. For the first three months of 2020, U.S. multifamily and commercial building starts inched up 1% from the same period of 2019.
During the shut-down in March and April, hospitals took a huge financial hit. Most of their revenue comes from non-life-threatening procedures, and these were halted causing US hospitals to lose more than $50 billion a month. Now that we’re facing a new wave of COVID-19, how will this affect hospitals looking forward? To get a clear picture, we looked at the general public’s interest in orthopedic procedures.
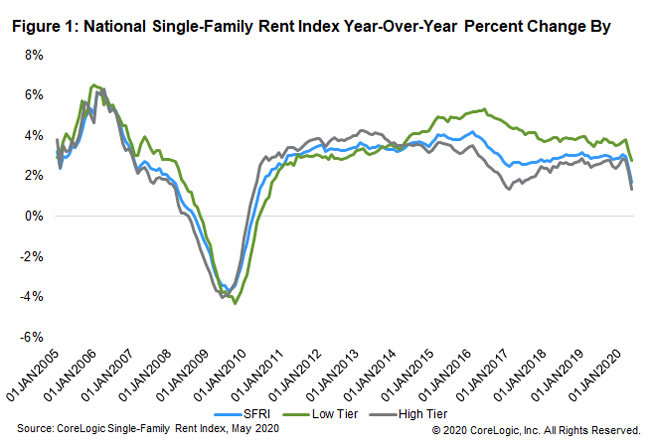
U.S. single-family rents increased 1.7% year over year in May 2020, a sharp slowdown from the prior month, and the lowest growth rate since July 2010, according to the CoreLogic Single-Family Rent Index (SFRI). The index measures rent changes among single-family rental homes, including condominiums, using a repeat-rent analysis to measure the same rental properties over time.
Data up until Saturday July 18th shows that mean footfall across all US Consumer industries has regained 90% of pre-lockdown levels, as Huq’s high-frequency geo-location data shows that the country is leading it’s comparative set of developed nations in terms of consumer-led economic recovery from Covid-19. Huq’s ‘All Consumer’ Indicator shows that the US had been tracking closely in line with China despite its head-start, with the two economic juggernauts rising steadily after lows in March 2020.
Total construction starts increased 6% in June to a seasonally adjusted annual rate of $641.4 billion. This marks the second consecutive monthly gain in construction starts following the COVID-19 induced declines in March and April. In June nonresidential building starts gained 6% and starts in the nonbuilding sector moved 27% higher. Residential starts, by contrast, fell 6% during the month. Through the first six months of the year, starts were down 14% from the same period in 2019.
The blows to the US retail sector continue. Well-known names declaring bankruptcy include Neiman Marcus, JC Penny, J. Crew, Tuesday Morning and GNC. More recently, Lucky Brand, Brooks Brothers, and Sure La Table have joined the list. One analysis is even suggesting the recent COVID-19-induced hit to retail is worse than that experienced during the Great Recession.
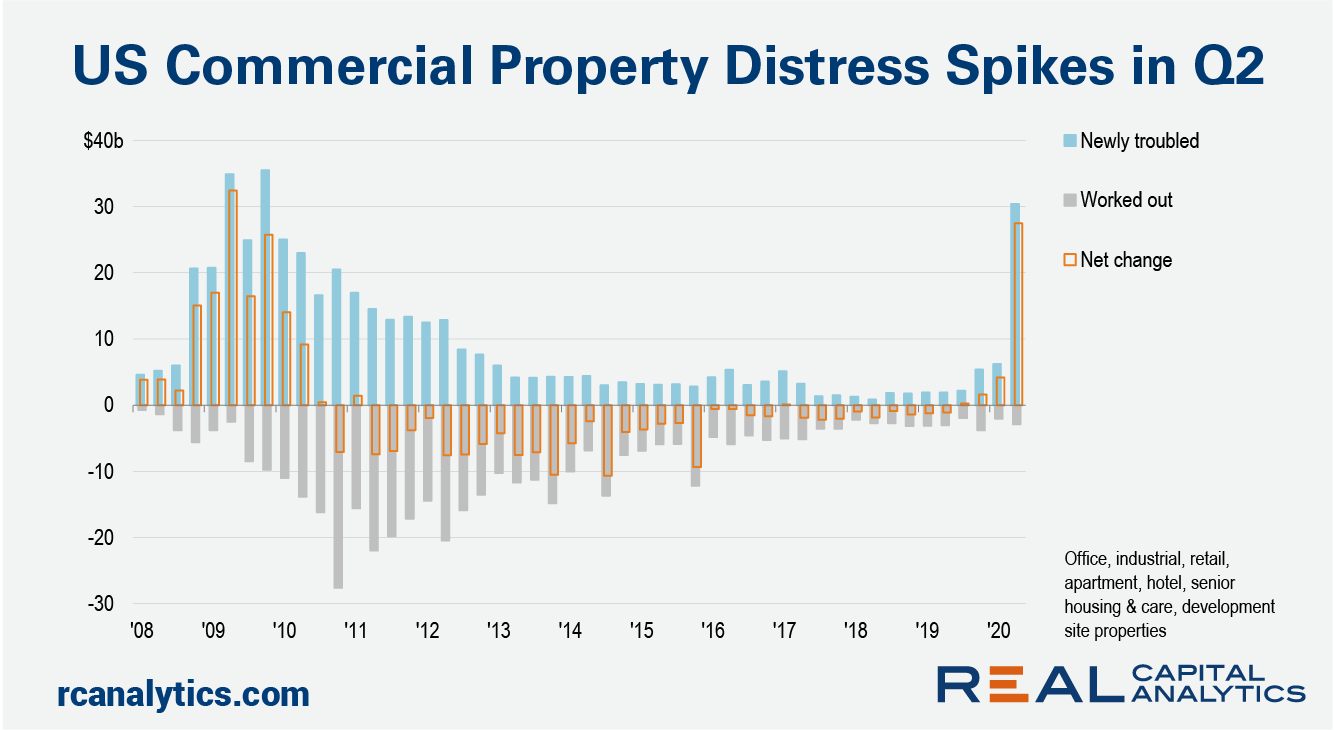
U.S. commercial real estate transaction activity during the coronavirus-blighted second quarter was far from the worst on record. However, the magnitude of the drop from the first quarter was unprecedented. Evidence of distress is mounting, according to Real Capital Analytics data, though it’s clear that the pain from the Covid-19 crisis has not been experienced equally across all the property types.
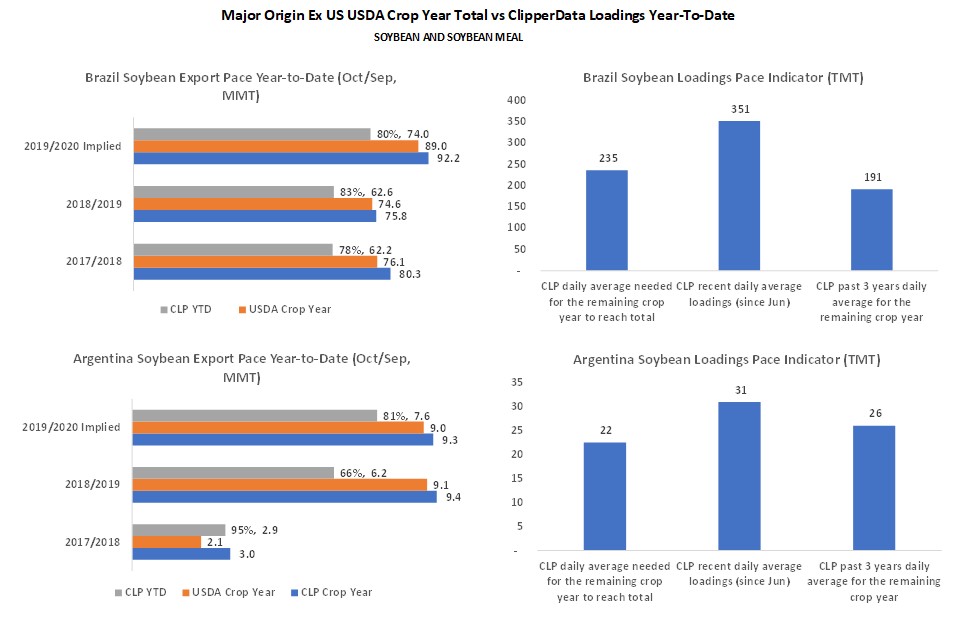
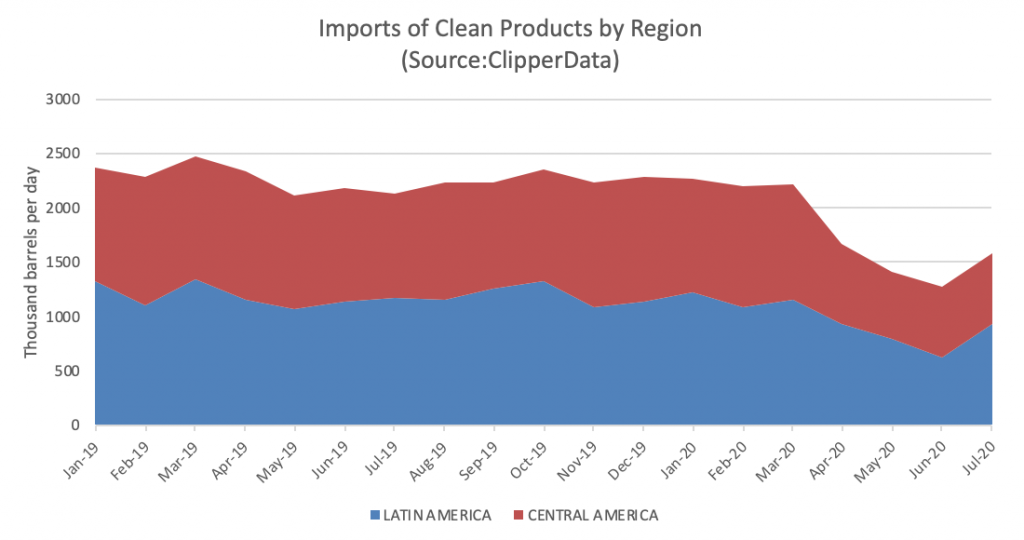
The export tracker provides us a view of where we stand in terms of pace in grains exports. By comparing Clipperdata’s up-to-date tracking of commodity loadings and the USDA estimated crop year exports, it calculates the ratio that has been shipped for the current marketing year, factoring a historical average difference between crop year Clipperdata trackings and USDA officials.
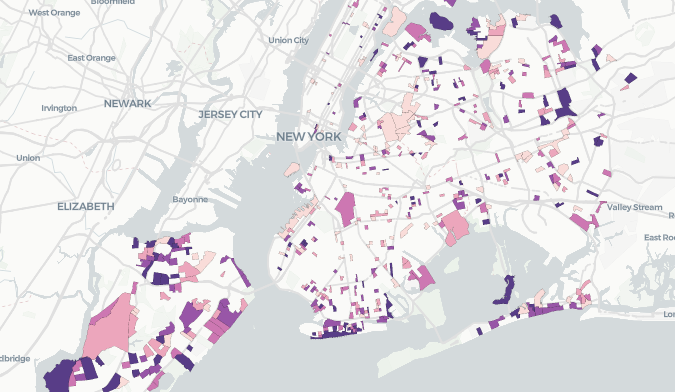
In general, we found that the areas that have returned Workers the most are the same - often low-income - areas hardest-hit by COVID-19, and that Workers in these areas tend to live around where they work. Conversely, the areas that have not returned as many Workers have a higher percentage of commuters, and are often more developed office building-oriented. When we dig in a little deeper, further distinctions arise between different boroughs and neighborhoods.
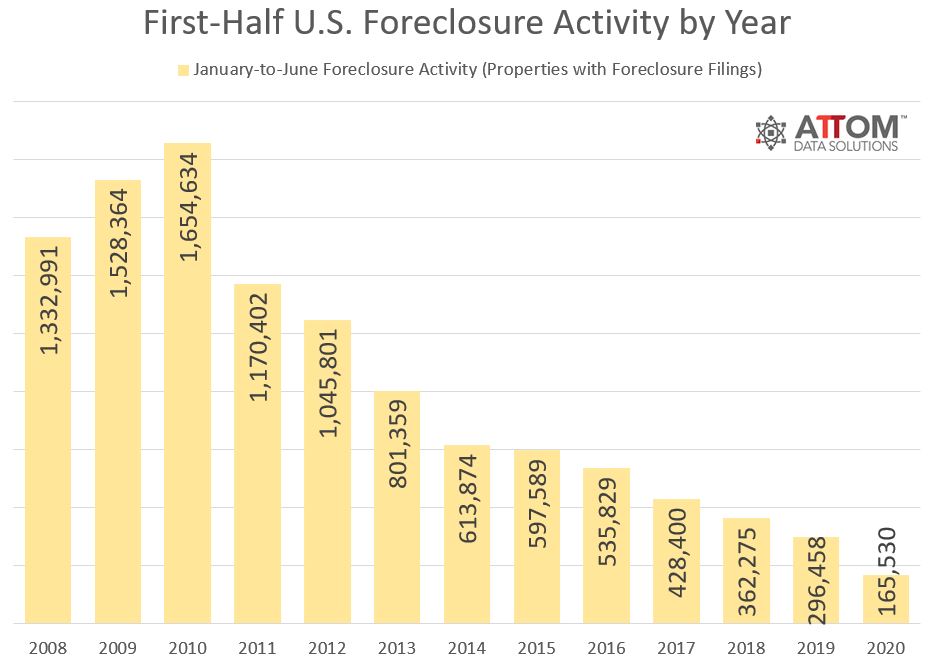
There were a total of 165,530 U.S. properties with foreclosure filings — default notices, scheduled auctions or bank repossessions — in the first six months of 2020, down 44 percent from the same time period a year ago and down 54 percent from the same time period two years ago.
We’re not quite ready to call it a new phase in our quarantine life, but the Reemergence Ramp has largely plateaued in recent weeks. The change kicked in around June 20th, as we saw regional upticks in cases throughout the south and west, and has persisted through some holiday spikes. We’ll dive into the slowdown of traffic in more detail below.
Over the past few months COVID-19 has brought the world to a startling halt. Across Canada, strict lockdown measures in mid-March forced Canadians to stay home. We saw the cancellation of all sporting and live events, the closure of bricks and mortar store fronts, and a significant impact to the economy.
Now in July, after more than three months of quarantine measures and more than 2.5 million cases across the region, it seems that the governments’ efforts to halt the spread of the disease have mostly been ineffective, leading to a higher infection rate, while putting the economic sustainability of millions in danger.
US consumer confidence slightly increased over the past few months but the difference among genders continues. According to data from Prosper Insight and Analytics, 43% of males responded that they were confident or very confident when they were asked on June 2020 about their feelings regarding the chances of a strong economy during the next six months, while only 31% of females felt the same way.
There are few sectors as central to the retail experience as grocery chains, and the wider space experienced a unique form of upheaval because of the pandemic. We dove into June data to get a sense of the pace of recovery, and which brands are well-positioned for the months to come. Spoiler – we also dug into early July.
Key industrials across Europe are showing signs of stronger recovery, with footfall to manufacturing plants in both staple and discretionary sectors reaching new highs in the last week. According to Huq’s ‘Key Industries Indicator’, which tracks the number of employees attending workplaces across a range of sectors, every industry measured has seen a sharp increase since the middle of last month
U.S. consumer spending has been altered by the coronavirus pandemic. Our data reveals that consumers are changing the way they pay for goods and services, with some industries seeing spending shift toward online purchases. Additionally, the pandemic has changed the types of purchases consumers are making, with stimulus recipients increasing their spending on big-ticket items. By analyzing industry-level data, consumer spending trends can provide insight into which sectors of the economy are recovering fastest.
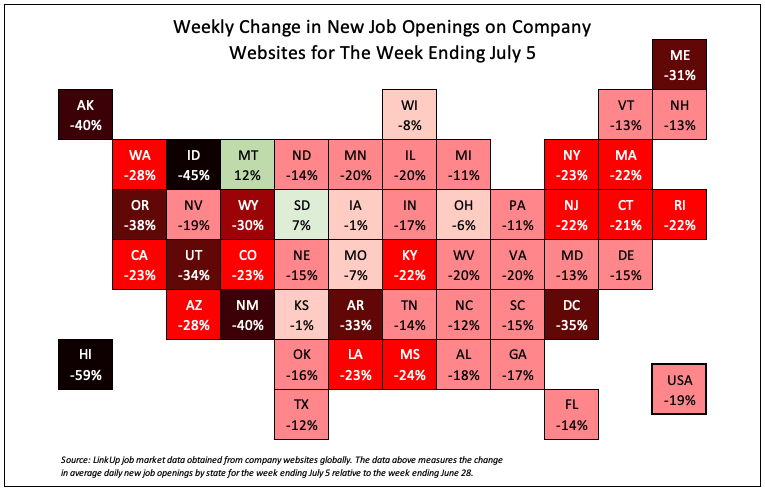
For the week ending July 5th, job openings on company websites dropped 19%, with declines in all but 2 states. It’s important to note that it was a holiday week and it’s not surprising that job openings would decline to some extent with people taking time off for the 4th. On the other hand, the horrific rise in COVID-19 cases in the U.S. in the past month or so, driven entirely by states that opened up way too fast without even the most basic, rational precautions like wearing masks, has resulted in states and businesses now closing things down.
Footfall to the hospitality sector across the UK climbed to 60% of pre-lockdown levels on ’Super Saturday’, but despite reports of crowded streets in Central London, a lack of tourists and entertainment saw pubs and restaurants in the Capital see just a quarter of their usual trade. Huq’s Indicator, which tracks footfall activity across the hospitality sector in the UK, dropped to a fifth of pre-lockdown levels throughout April and May as businesses pivoted their offerings but has yet to see the bounce back that people have been hoping for.