Population mobility in the UK remains around half of its pre-pandemic level as we look back on a year of restrictions. Huq’s high-frequency footfall data provides an accurate measure of how policy has impacted movement in the UK throughout the pandemic, which averages around -40pts throughout the last year. As restrictions eased last summer, high-street footfall reached a peak of 75% of the January 2020 mean in July and August, before dropping to a series low of 40% at the start of this year.
The pandemic has tested businesses across all industries, but it seems some are emerging stronger than ever. One example of this may be Salesforce. Job listings at the customer relationship management (CRM) software giant have drastically increased lately. Jobs listings are up 622% since beginning their climb in June of 2020. Prior to this rise, jobs had been relatively steady since 2018.
The Association of American Railroads (AAR) today reported U.S. rail traffic for the week ending March 20, 2021. Comparisons of the current week with the same week in 2020 are inflated because of the widespread economy-wide shutdowns — and subsequent large reduction in rail volumes — last year at this time. For this week, total U.S. weekly rail traffic was 513,325 carloads and intermodal units, up 11.6 percent compared with the same week last year.
While the change in migration during COVID was not as dramatic as some expected, even small shifts in migration patterns could have major implications for strategic business decisions. The way Americans move can impact the way retailers reach their audiences, which office space strategies top employers must utilize, and how cities and regions drive key tax revenue. State-level migration data shows that the population change that most states experienced between January 2021 and the previous January did not exceed 1%. This limited net change shows the ‘stickiness’ of a home area, which is heavily influenced by work, family, schools, the cost of living, and more.
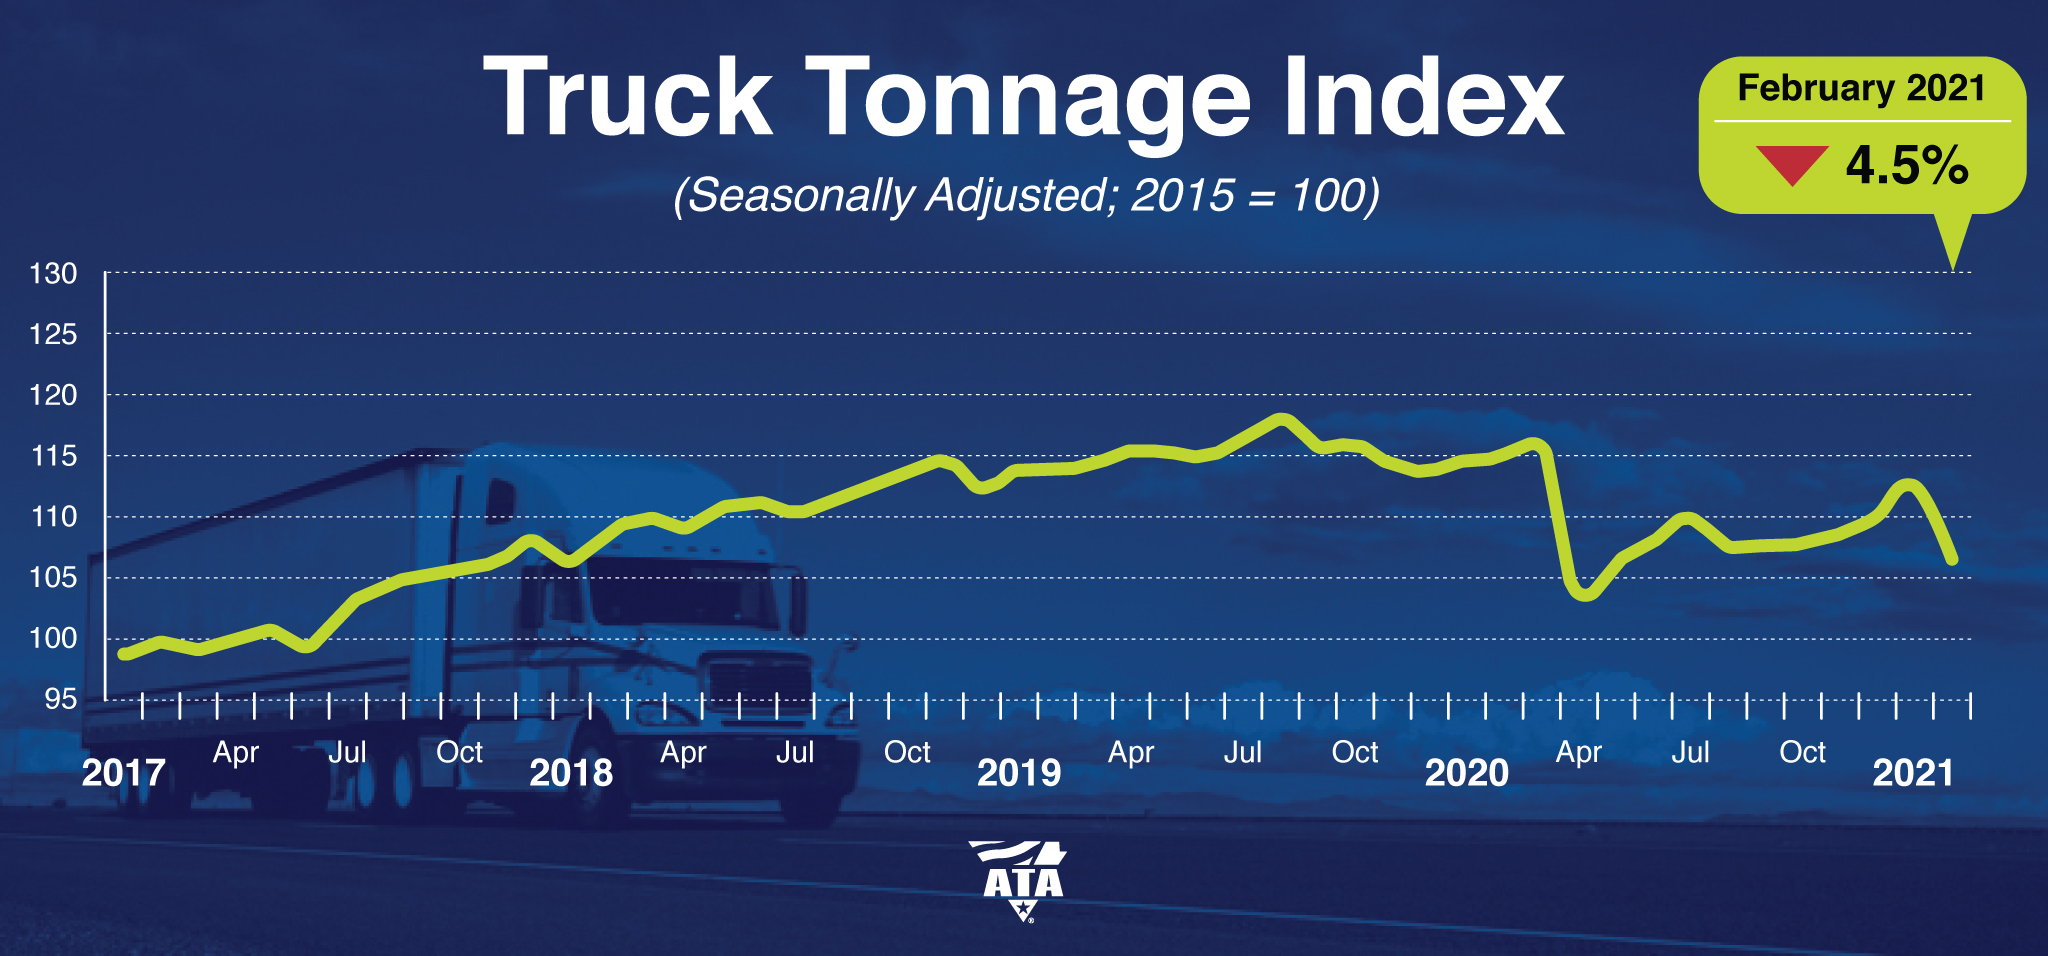
American Trucking Associations’ advanced seasonally adjusted (SA) For-Hire Truck Tonnage Index decreased 4.5% in February after rising 1.8% in January. In February, the index equaled 110 (2015=100) compared with 115.2 in January. Compared with February 2020, the SA index fell 5.9%, which was preceded by a 1.6% year-over-year decline in January. In 2020, the index was 4% below the 2019 average.
STR’s latest 51-chart demand map through 13 March 2021 shows that most states are moving closer to their levels from the same time last year. Unfortunately, those demand levels from comparable periods in 2020 were lowered substantially by the earliest pandemic lockdowns. A clear majority of states have made solid progress in shrinking the tremendous demand deficits that developed during the worst times of the pandemic. However, current bookings shortfalls from pre-pandemic times remain significant, particularly in a handful of states dominated by the largest urban markets.
In-person supermarket visits in the EU are at their lowest point since the start of the pandemic, with trips reaching to a new low of just 34% of previous levels as coronavirus cases rise sharply in the region once again. Footfall to stores had tracked as high as 80% of usual levels at the start of the year before experiencing a sharp decline since February, which saw both France and Poland reintroducing partial lockdowns to fight a third wave.
CE Transact data has tracked Kingfisher sales very well in the UK, with high correlations to reported results. Our recent launch of online vs. offline channel breakouts in the UK provides further insight into what has helped the home improvement retailer weather the COVID storm. While Kingfisher’s growth lagged overall UK Home & Garden spend throughout 2019, the company got a big boost during the pandemic. KGF sales grew over 30% y/y in May 2020 while overall Home & Garden was still declining, and outpaced industry growth when Home & Garden recovered to 28% growth in June.
U.S. consumer spending has been altered by the coronavirus pandemic. Our data reveals that consumers are changing the way they pay for goods and services, with some industries seeing spending shift toward online purchases. Additionally, the pandemic has changed the types of purchases consumers are making, with stimulus recipients increasing their spending on big-ticket items. By analyzing industry-level data, consumer spending trends can provide insight into which sectors of the economy are recovering fastest. Overall, consumer spending in February versus the same month in 2020 is up 13 percent across all sectors, an aggregation of over 5,200 major U.S. companies.
In our recent Energy Sector Jobs Report, we explore an industry in transition. The shift from traditional fossil fuels to renewable energy sources continues to gain momentum on the heels of a record-breaking year for clean energy installations and acquisitions. The report gives an overview of how job listings in the sector are changing, as well as which companies are growing and which are declining. To expand on this analysis, we decided to take a deep dive into a few standout companies identified in the report to see how their job listings and share prices have changed amid recent growth initiatives.
Presence across UK quick-service restaurants is showing signs of awakening for the first time since the start of the current national lockdown, with high-frequency geo-location data recording an increase in attendance from a very low base. Although levels remain just a fraction of what they were before the pandemic – and have yet to climb higher than 11% of the January 2020 mean – the data shows how collections are driving footfall ahead of hospitality reopening on 12 April.
As we pass the anniversary of the start of the pandemic (the WHO declared COVID-19 a pandemic on March 11th), and with over 20% of the US population now vaccinated with at least one dose as of March 14th, we examined how consumers have behaved from then to now. We look at consumer spending and foot traffic across the most and least vaccinated states, how new shoppers acquired during COVID are being retained across retailers, and how share of wallet has potentially changed over the past year.
One year after the initial lockdowns and stay at home orders across the groble, Americans are now driving a lot more, as measured by our miles driven index. More specifically, the last three weeks Advan’s miles driven index captured an increase in traffic as high as 40% nationwide compared to the pre-pandemic levels in February 2020. As the vaccines are being rolled out people’s confidence is picking up and in combination with certain COVID-related restrictions being lifted and the advent of Spring and Spring breaks, everyone seems to be making up for lost travel.
The Association of American Railroads (AAR) today reported U.S. rail traffic for the week ending March 13, 2021. For this week, total U.S. weekly rail traffic was 520,736 carloads and intermodal units, up 12.5 percent compared with the same week last year. Total carloads for the week ending March 13 were 230,684 carloads, up 2.1 percent compared with the same week in 2020, while U.S. weekly intermodal volume was 290,052 containers and trailers, up 22.4 percent compared to 2020.
In-person visits to UK high street banks has remained static at around 50% of pre-pandemic levels since the start of 2020, with the number of visits climbing just 6pts during February despite the end of the financial year approaching. Bank visits dropped to around 40% of the January 2020 average during the first national lockdown before recovering to 85pts over the summer. However, despite a brief peak to 70% of ‘usual’ levels in the run up to Christmas, activity remains largely flat.
Total construction starts fell 2% in February to a seasonally adjusted annual rate of $797.3 billion. Nonbuilding construction starts posted a solid gain after rebounding from a weak January, however, residential and nonresidential building starts declined, leading to a pullback in overall activity. The Dodge Index fell 2% in February, to 169 (2000=100) from January’s 171.
How strictly have businesses been adhering to COVID restrictions? We'll be taking a look at Washington State, which has a COVID reopening plan that staggers reopening phases by county. Why is this handy? Because we can look at the "reopening phase" changing in some counties but not others. This gives us a baseline of behavior in places where the rules aren't changing, so we can see if people actually change their behavior when the rules change.
Transits through the UK’s largest ports of entry have risen past pre-Covid levels for the first time in over a year, as high-frequency data from Huq shows how international trade could be bouncing back after reaching record lows. Journeys through the likes of Felixtstowe, Dover and Southhampton had recovered over last summer to around 90% of pre-pandemic levels before the latest national lockdown saw this figure drop to around 75%.
Hotels in the Middle East have shown resilience throughout the pandemic, with performance at higher levels compared to other parts of the world. Those higher levels have been highlighted by the region’s key markets. Dubai was virtually the only tourist destination open for international leisure travel, while Abu Dhabi hosted the International Defense Exhibition (IDEX) in person in late February 2021 with zero quarantine requirements for international arrivals.
Over the past few years the number of Special Purpose Acquisition Companies (SPACs) going public has exploded. A number of those have completed an acquisition and are now trading as that target company. Using SPACtrack.net, we took a look at a subset of these companies hoping to determine whether the hiring patterns of these SPACs could tell us something about their future performance. In our analysis, we separate our SPACs into groups by performance, and dig deeper into each group’s hiring practices to determine what differentiates them.


