The CoreLogic Loan Performance Insights report features an interactive view of our mortgage performance analysis through April 2022. Measuring early-stage delinquency rates is important for analyzing the health of the mortgage market. To more comprehensively monitor mortgage performance, CoreLogic examines all stages of delinquency as well as transition rates that indicate the percent of mortgages moving from one stage of delinquency to the next.
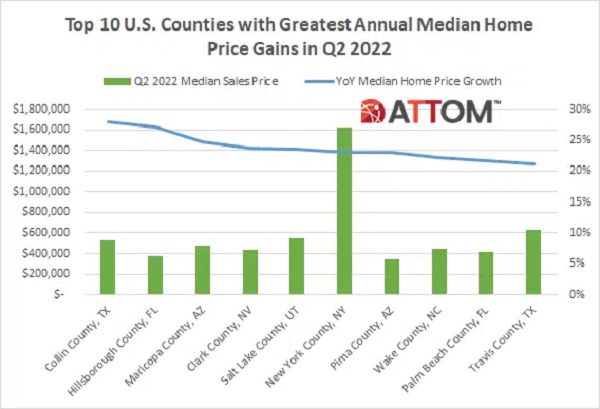
ATTOM’s just released Q2 2022 U.S. Home Affordability Report shows that median-priced single-family homes and condos were less affordable in Q2 2022, compared to historical averages in 97 percent of U.S. counties. The report noted that figure was up from 69 percent in Q2 2021, to the highest point since 2007 – just before the housing market crashed during the Great Recession of the late 2000s.
Although the real estate market showed signs of receding in Q4 2021, investors resumed their buying spree in early 2022. Investors made 28.1% of all single-family purchases in February, a record high according to CoreLogic’s data that goes back to 2011. March registered similarly high figures, with an investor share of 27.9%. Figure 1 depicts this bounce back in investor interest with investor share of home purchases rising nearly 5 percentage points from December (21.8%) to January (26.6%).
While 2021 was a banner year for the overall housing market, it proved particularly strong for luxury home purchases. Sales of luxury homes — defined as homes priced at or above $2 million — jumped 72% in 2021 compared to the year prior and 116% when compared to 2019. Although all price segments within the luxury home market saw a substantial jump, the largest increase occurred for homes priced between $10 and $20 million, a segment which was up 89% in 2021.
Welcome to the July 2022 Apartment List National Rent Report. Our national index rose by 1.3 percent over the course of June, consistent with last month’s increase. So far this year, rents are growing more slowly than they did in 2021, but faster than they did in the years immediately preceding the pandemic. Over the first half of 2022, rents have increased by a total of 5.4 percent, compared to an increase of 8.8 percent over the same months of 2021. Year-over-year rent growth currently stands at a staggering 14.1 percent, but has been trending down from a peak of 17.8 percent at the start of the year.
In our most recent white paper, we took a closer look at the home improvement and decor sector. We examined how recent economic shifts are affecting the industry and how consumer attitudes are changing as the pandemic fades into the background and inflation takes center stage. Shifts in home ownership can have a significant impact on the home improvement sector. Now, homeowner rates are dropping in 2021 for the first time in five years, and rising housing prices and increasing rental costs are making it difficult for potential buyers to enter the market.
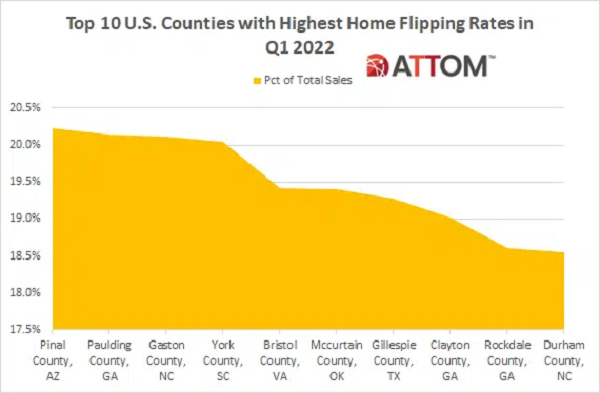
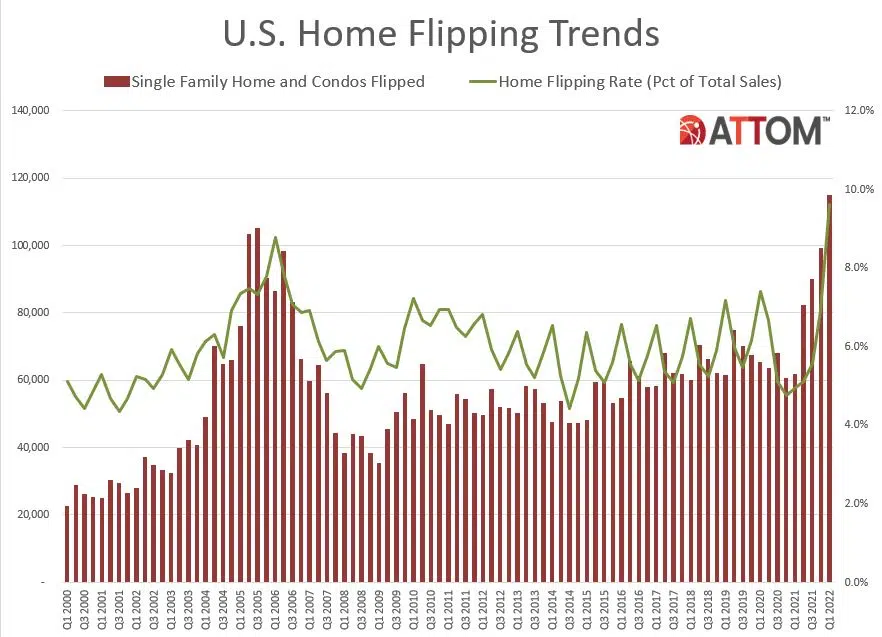
According to ATTOM’s just released Q1 2022 U.S. Home Flipping Report, the home flipping rate in the first quarter was at the highest level since at least 2000, with single-family home and condo flips representing 9.6 percent of all home sales. The report noted that figure was up from 6.9 percent in Q4 2021 and 4.9 percent in Q1 2021. ATTOM’s latest home flipping analysis also reported that jump in the home flipping rate in Q1 2022 marked the fifth straight quarterly increase, and the largest quarterly and annual percentage-point gains since 2000.
ATTOM, a leading curator of real estate data nationwide for land and property data, today released its first-quarter 2022 U.S. Home Flipping Report showing that 114,706 single-family houses and condominiums in the United States were flipped in the first quarter. Those transactions represented 9.6 percent of all home sales in the first quarter of 2022, or one in 10 transactions – the highest level since at least 2000. The latest total was up from 6.9 percent, or one in every 14 home sales in the nation during the fourth quarter of 2021, and from 4.9 percent, or one in 20 sales, in the first quarter of last year.
CoreLogic, a leading global property information, analytics and data-enabled solutions provider, today released its latest Single-Family Rent Index (SFRI), which analyzes single-family rent price changes nationally and across major metropolitan areas. U.S. single-family rent growth continued its hot streak in April, with prices up by 14% year over year, the 13th consecutive month of record-breaking annual gains. As in past months, a shortage of rental properties on the market is putting pressure on prices, as is a thriving job market, with the nation’s economy adding nearly 430,000 new positions in April and an annual wage increase of 5.5%.
The CoreLogic Loan Performance Insights report features an interactive view of our mortgage performance analysis through March 2022. Measuring early-stage delinquency rates is important for analyzing the health of the mortgage market. To more comprehensively monitor mortgage performance, CoreLogic examines all stages of delinquency as well as transition rates that indicate the percent of mortgages moving from one stage of delinquency to the next.
Despite much multifamily analysis lauding 2022 as a continuation of 2021’s generational numbers in rent growth and absorption, 2022 has brought significant change for the industry. Certainly, looking at 12-month numbers paints a rosy picture. Yet, as has previously been covered at ALN, apartment demand has winnowed significantly on a year-to-date basis. Rent growth, now somewhat detached from demand, appears to be relying more on momentum and continued low vacancies after last year’s net absorption explosion. Neither factor is guaranteed to persist.
The CoreLogic Homeowner Equity Insights report, is published quarterly with coverage at the national, state and Core Based Statistical Area (CBSA)/Metro level and includes negative equity share and average equity gains. The report features an interactive view of the data using digital maps to examine CoreLogic homeowner equity analysis through the first quarter of 2022. Negative equity, often referred to as being “underwater” or “upside down,” applies to borrowers who owe more on their mortgages than their homes are worth. Negative equity can occur because of a decline in home value, an increase in mortgage debt or both.
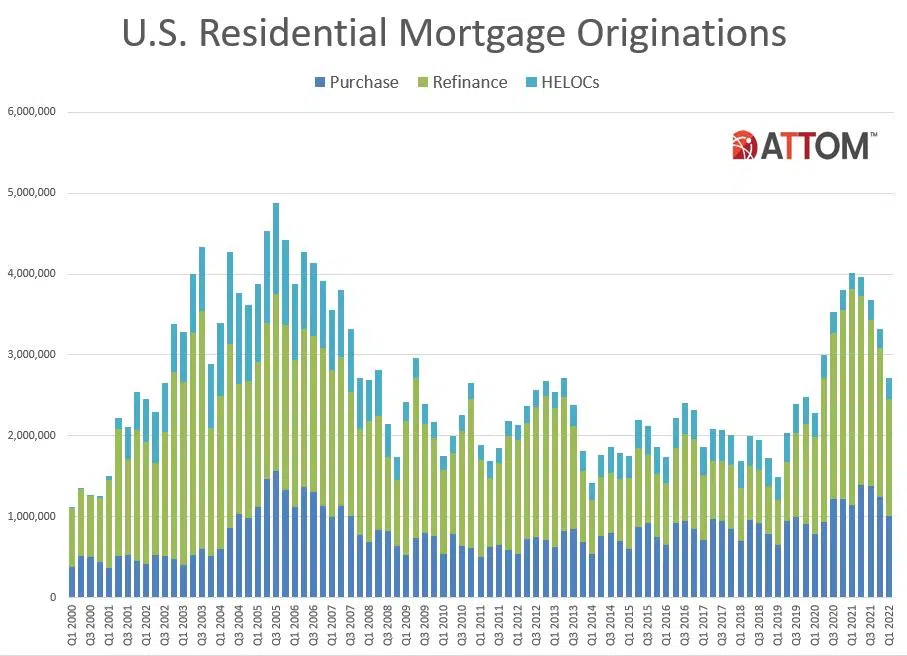
ATTOM, a leading curator of real estate data nationwide for land and property data, today released its first-quarter 2022 U.S. Residential Property Mortgage Origination Report, which shows that 2.71 million mortgages secured by residential property (1 to 4 units) were originated in the first quarter of 2022 in the United States. That figure was down 18 percent from the fourth quarter of 2021 – the largest quarterly decrease since 2017 – and down 32 percent from the first quarter of 2021 – the biggest annual drop since 2014.
At Apartment List, our research team is committed to providing accurate and timely data so that those interacting with today's quickly changing housing market can make well-informed decisions. For years, our Monthly Rent Estimates have equipped researchers, journalists, industry specialists, and the general public with data on the latest pricing trends. Today, we’re thrilled to announce the release of our newest data product -- the Apartment List Vacancy Index.
Any home loan that doesn’t comply the Qualified Mortgage (QM) rules is referred to as non-QM. The Dodd-Frank Wall Street Reform and Consumer Protection Act imposed an obligation on lenders to make a good-faith effort to determine applicants have the ability to repay a mortgage, which is known as the ability-to-repay (ATR) rule. The act also mandates the QM cannot have risky loan features like negative-amortization, interest-only, balloon payments, terms beyond 30 years and no excessive points and fees. The QM must also satisfy at least one the following criteria:
Welcome to the June 2022 Apartment List National Rent Report. Rent growth accelerated slightly again this month, with our national index up by 1.2 percent over the course of May. So far this year, rents are growing more slowly than they did in 2021, but faster than the growth we observed in the years immediately preceding the pandemic. Over the first five months of 2022, rents have increased by a total of 3.9 percent, compared to an increase of 6.1 percent over the same months of 2021.
CoreLogic, a leading global property information, analytics and data-enabled solutions provider, today released its latest Single-Family Rent Index (SFRI), which analyzes single-family rent price changes nationally and across major metropolitan areas. U.S. single-family rent price growth continued at a record pace in March, up 13.6% from one year earlier. Slim inventory continues to squeeze renters, as do robust home price gains – both familiar culprits in declining affordability.
Inflation poses a challenge for the financing of commercial real estate. As inflationary pressure pushes up interest rates, the cost to finance commercial real estate investments can increase as well. U.S. commercial mortgages originated in 2021 had an average 3.7% coupon rate for 7/10-year fixed rate products. Into March of this year, this rate had climbed to 4.3%, an extra 60 basis points. Increases in other rate instruments could foretell further commercial rate increases if traditional relationships hold moving forward.
The CoreLogic Loan Performance Insights report features an interactive view of our mortgage performance analysis through February 2022. Measuring early-stage delinquency rates is important for analyzing the health of the mortgage market. To more comprehensively monitor mortgage performance, CoreLogic examines all stages of delinquency as well as transition rates that indicate the percent of mortgages moving from one stage of delinquency to the next.
ATTOM’s newly released Best Days to Sell A Home Analysis reveals that the months of May, June and July offer seller premiums of 10 percent or more above market value, based on home sales over the past 11 years – with the top 15 best days to sell in the month of May alone. According to ATTOM’s latest analysis of more than 46 million single family home and condo sales between 2011 and 2021, the Spring and Summer months continue to prove more profitable for home sellers.


