With Back-to-School shopping in full swing, we dove into visits to Five Below to see how this fast-growing discount retailer is pulling ahead of the wider dollar & discount store category. Inflation may be slowing down, but high prices are still impacting shopping habits, with consumers looking to stretch their budgets driving a 16.4% increase in foot traffic to the category relative to January 2022. But despite the strength of the wider category, Five Below continues to outperform the dollar and discount store average. July 2022 foot traffic to Five Below was up 41.8% relative to January 2022 – more than double the wider discount and dollar store increase.
Welcome to the September 2022 Apartment List National Rent Report. Our national index rose by 0.5 percent over the course of August, half the rate of growth compared to last month. This marks a deceleration of the rental market that follows a typical, pre-pandemic trend. This year rents have risen slightly faster than they did before the pandemic, but significantly slower than they did in 2021 when rent inflation was at its peak. So far in 2022 rents are up 7.2 percent, compared to 14.8 percent at this point in 2021. Year-over-year growth has slowed to 10 percent, down from a pearl of nearly 18 percent at the beginning of the year.
Well past the second anniversary of the pandemic, business travel has yet to recover. There have been green shoots of hope seen in increasing weekday demand across the U.S. and U.K. as well as signs of recovery in traditionally business-focused urban hotels. However, consumer sentiment suggests a full return to pre-COVID levels of business travel may never occur. If there is full recovery in terms of volume, the composition of the segment will probably look different.
The plus-size fashion industry is one of the fastest growing apparel sectors in the U.S. – valued at $24 billion per year and sales revenue for the category grew about three times faster than consumer spending on the rest of the women’s apparel market between 2019 and 2021. With the strength of the body-positivity movement growing, we took a look at the recent foot traffic performance of three leading plus-size retailers – Destination XL, Lane Bryant, and Ashley Stewart.
Back to school spending in states where class is back in session** fell 10% YoY at key retailers* for the 4 weeks ended August 17, 2022 as schools reopened in a challenging inflationary environment. The decline comes after the initial shock of pandemic-driven remote learning in 2020 drove a similar 10% YoY decline, while assistance in the form of child tax credit payments in 2021 pushed growth near 25% YoY. Growth during this key spending period in August 2022 is a full 30 points slower than in 2021. Pre-pandemic back to school spending was largely flat during the same period in 2019.
Recent trends in inflation and other macroeconomic factors have created interesting idiosyncrasies in company reported performance. One of the most interesting sectors has been department stores, where the interplay between full-line full price, clearance, and off-price has played out differently across the different companies in the space. In today’s Insight Flash, we look at overall industry and subindustry trends, average ticket, and ticket buckets to understand how spend has shifted in the Department Store space.
Big-box stores Target Corporation (NYSE: TGT) and Walmart Inc (NYSE: WMT)—which both recently reported their quarterly earnings—have faced excess inventory challenges over the last few months, slashing prices even as inflation has soared to new heights. Our credit and debit card transaction data reveals that in 2022, monthly average transaction values have generally increased year-over-year at Walmart Inc, but decreased slightly at Target. Additionally, our analysis shows that the share of online sales at both retailers is still elevated compared to pre-pandemic levels.
This Placer Bytes dives into recent foot traffic trends for Best Buy and GameStop to understand how inflation and rightsizing efforts are impacting visits to these two electronics retail leaders. Best Buy’s brick and mortar visits were relatively unaffected by the pandemic, with the brand showing a particularly strong Black Friday performance in 2021. But in recent months, as inflation drove consumers to hold off on larger purchases, including electronics, Best Buy visits have taken a hit.
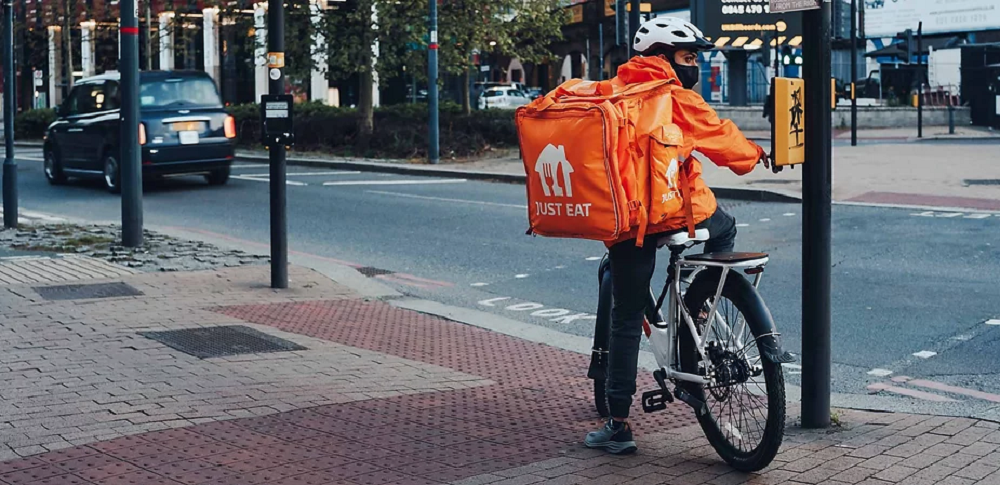
The rise in the use of Food Delivery apps has been well documented with the pandemic serving up a hearty main course for many of the industry’s participants. However, as we have emerged from the depths of lockdowns delivering consistent tailwinds for growth in 2020 and 2021, we ask the questions - how has this sector performed through the first half of 2022? And what is the outlook in the current economic environment?
After a wave of new streaming services have crowded consumers’ Roku screens and spurred requests for shoppers’ roommate’s cousin’s girlfriend’s father’s password, have we finally hit a saturation point for streaming services? Two recent consolidations suggest that we may have, with HBO Max and Discovery+ to merge into one service and Walmart (which sold its Vudu service to Fandango) to partner with Paramount+ by offering the service free for Walmart+ customers.
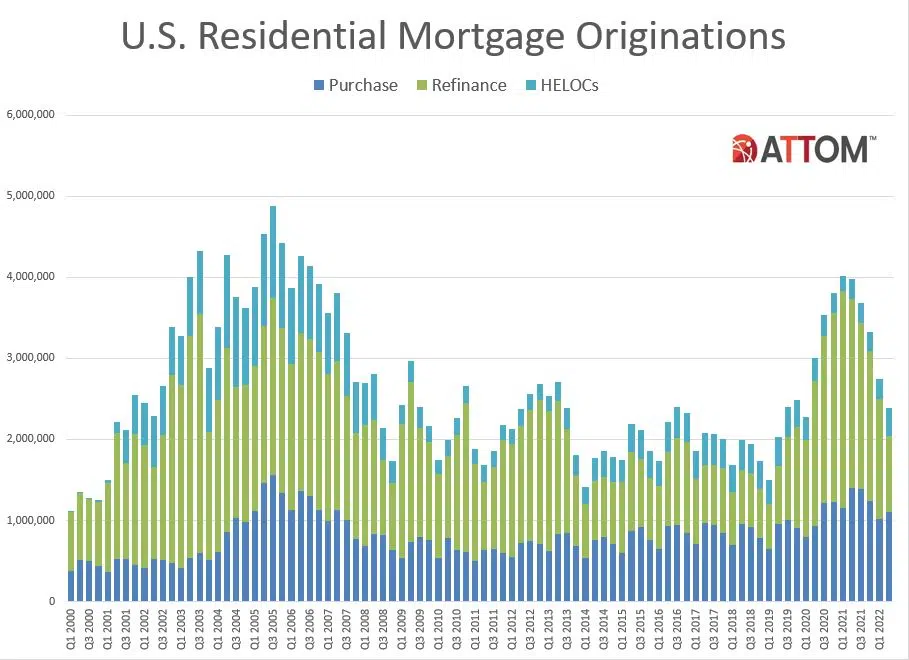
ATTOM, a leading curator of real estate data nationwide for land and property data, today released its second-quarter 2022 U.S. Residential Property Mortgage Origination Report, which shows that 2.39 million mortgages secured by residential property (1 to 4 units) were originated in the second quarter of 2022 in the United States. That figure was down 13 percent from the first quarter of 2022 – the fifth quarterly decrease in a row – and down 40 percent from the second quarter of 2021 – the biggest annual drop since 2014.
Many companies provide their employees with benefits, perks, and flexibility to foster employee satisfaction. In our recent collaboration with USNews, we looked at a combination of less tangible factors like feelings of fulfillment at work and a sense of community, alongside material factors like good compensation, to identify Nvidia, KLA, Zoom, Atlassian, Enphase, and Qualcomm as the companies with the happiest employees. But how about the runner-ups? Here are the full rankings of companies according to these metrics.
The rise in retail foot traffic and consumer demand in the pet sector has been a recurring theme since the early days of the pandemic. With Petco building on the success of its pet wellness and omnichannel ecosystem, we dove into the recent visit data and took a closer look at the chain’s launch into smaller, rural markets. Pet adoptions surged in the early stages of the pandemic, driving significant foot traffic to Petco. As the majority of these pets remain in their new homes, overall visits to Petco are continuing on their positive trend in comparison to 2019.
Peloton IAP Revenue reached a new all-time-high in May, earning 41% above its previous best month, May 2021. Since April, monthly IAP Revenue estimates have been above the May 2021 peak. While IAP Revenue has never looked better for Peloton, monthly active users (MAU) declined -36% year-over-year (YoY) in Q2 and negative YoY growth continues in the summer months. Average MAU for Peloton and fitness competitors (Nordic Track, Echelon, Bowflex) has declined -53% since April 2021, as Gym and Fitness Studio apps grew average MAU 84%.
Beauty products are often seen as an “affordable luxury,” and shoppers looking for budget-friendly splurges are increasing their offline beauty visits even as discretionary spending in other categories drops. To better understand the current beauty surge, we dove into Ulta Beauty’s year-to-date foot traffic performance to see how the wider economic situation is boosting this already strong retailer.
Beauty Retail and Direct-to-Consumer (D2C) Apparel apps are driving more daily active users (DAU) in the last 30 days than during the peak of 2021 holiday shopping. Daily users engaging with D2C Apparel apps have increased 5% from December 2021, and 2% for Beauty Retail apps. Historically for these retail categories, they reach a new all-time-high engagement rate each December. In the last three years, the record engagement would not be surpassed until Q4.
The sporting goods space had a particularly strong 2021 as consumers stocked up on home workout equipment during the pandemic. With fitness foot traffic on the rise, we dove into the visit data for two leading sporting goods brands – DICK’s Sporting Goods and Hibbett Sports – and took a closer look at the trends driving brick-and-mortar visits to the chains. Though offline fitness has returned, year-over-three-year (Yo3Y) visits to DICK’s and Hibbett demonstrate that the chains are maintaining their pandemic-driven gains.
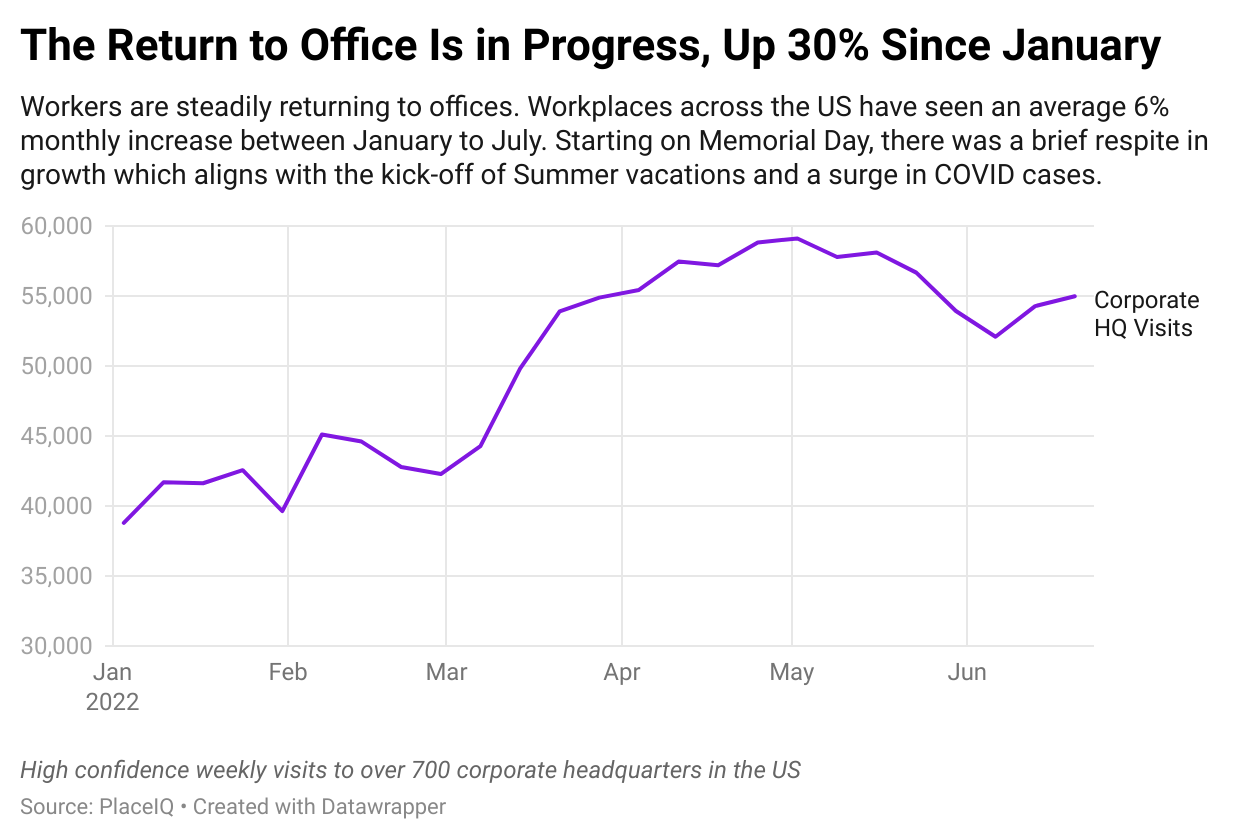
While the debate between remote, on-site, and hybrid work continues to bubble, visitation to offices is steadily tracking upwards. There’s been a lot of discussion these past few months about the return to the office, working from home, and hybrid scenarios. We’ve read arguments for one way or the other, but the facts on the ground show that a steady, stable return to the workplace is underway. Offices are seeing 30% more traffic than they saw in January, as measured by PlaceIQ’s movement data metrics.
On March 11, 2020, the World Health Organization (WHO) put everyone on notice when they announced that the COVID-19 outbreak was officially a pandemic. In the two-plus years since the pandemic, a lot has changed, including the spending habits of advertisers who found themselves trying to make sense of shifting consumer behaviors and shrinking ad budgets. As the pandemic waned, advertisers understandably increased spending as they looked to capitalize on the spending surge and recoup lost revenue.
Heading into 2020, cycling studios and spin classes were gaining speed. As studios closed, at-home cycling brands kept the trend in focus. But troubles at Peloton earlier this year followed by a recent announcement from Soul Cycle that it was closing a quarter of its studios seem to indicate that the workouts have gone off course. In today’s Insight Flash, we examine how spin classes have fared versus overall athletic clubs in our CE Transact data, then deep dive into specific trends for Peloton class attendance using our CE Web data, followed by tracking the markets where SoulCycle is closing from our CE Transact data.


