The top 10 quick-service restaurant apps in the U.S. were downloaded 10.3 million times in August, 14.8 percent less than those the month prior. Year-over-year in the month of August, downloads of the top 36 quick-service restaurant apps are up 18.9 percent. A download represents a new user and the first conversion on the mobile app customer’s journey. While the order has changed, every one of July’s 10 most downloaded quick-service restaurant apps have returned in August’s lineup. Dunkin’ moved up two spots from No. 9 to No. 7, very likely due to the release of its pumpkin spice flavored drinks and treats.
The return of pumpkin-themed menu items signals the arrival of fall in the coffee space. Over the years, everything from pumpkin spice lattes to pumpkin muffins have gained a massive following. We dove into the foot traffic data for two leading QSRs – Starbucks and Dunkin’ Donuts – to take a closer look at how the launch of fall menu items drove visits to the chains. To analyze the impact of Dunkin’s and Starbucks’ fall menu launches, we compared each chain’s average visits in the five weeks prior to its fall menu launch to visits in the seven days post-launch.
As worldwide inflation has increased the costs of food, are customers keeping their taste for Meal Kits? In today’s Insight Flash, we look at trends for the top Meal Kit companies in the US and UK, focusing on spend growth, pricing, and retention. In the US, Meal Kits subindustry growth has been stronger than in the UK over the last 35 days on a one-year, two-year, and three-year basis. Compared to three years ago, spend in the US was up 119% versus a still healthy 97% for the UK, 25% versus 18% compared to two years ago, and a positive 4% versus negative -10% compared to last year.
The vibes surrounding consumer financial companies are not what they used to be, but Apptopia data makes one think the negative sentiment has gone too far. While installs (new users) of top consumer fintech apps are down 14% year-over-year in Q3, they are up 19.4% over Q3 in 2020. This is more of a situation where water is finding its level. Still, that doesn't mean that things are not shifting and responding to economic activity. Certain sectors of the fintech industry are being hit harder than others, while some are growing as opportunity (via inflation) presents itself.
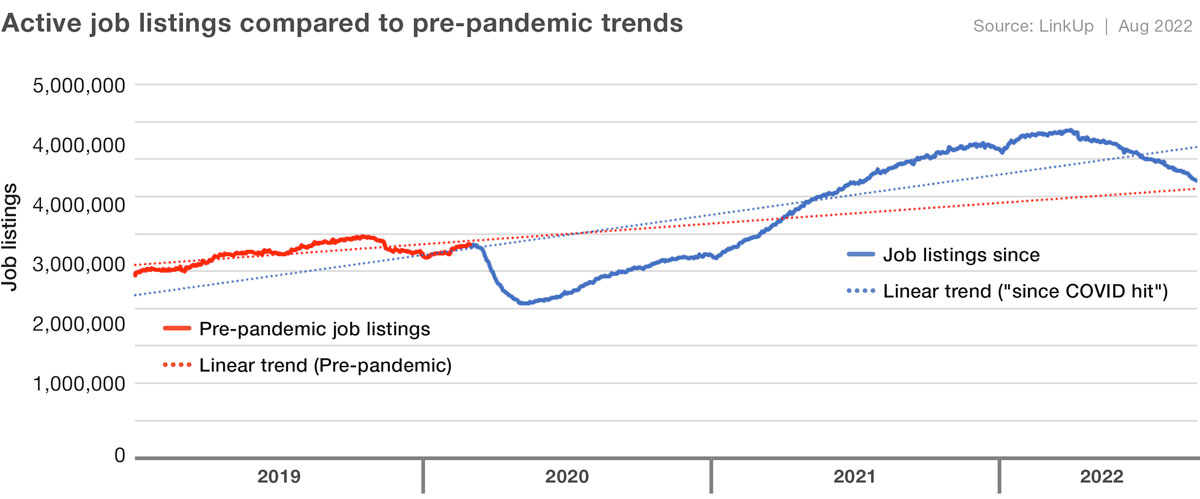
On October 4th, the Bureau of Labor Statistics (BLS) will be releasing its JOLTS data for August that will include the much-anticipated job openings data for the month. Based on LinkUp’s job listings data sourced directly from company websites in July and August, we are forecasting that job openings in the U.S. declined last month, dropping 2.6% to 10,950,000.
With the 2022 school year just starting in the US, we use our unique demographic data to isolate households with children and see how their spending patterns have changed versus previous years. In today’s Insight Flash, we look at total back to school spend for households with children, a breakdown in growth rates by subindustry, and which brands saw the strongest trends. Since just after back to school three years ago in September 2019, spend has risen more quickly for households with children than for those without.
Abstract There has been a heated debate over the last few months over the question of how many real human users Twitter has. While all previous work, focused on analysis of Twitter accounts and attempts to classify bots, Similarweb takes a different, unique approach. We apply an explainable machine learning algorithm using datasets of digital activities of panels of users to provide robust estimates of Twitter’s average Monetized Daily Active Users (mDAU) for the US over the period of Q3 2021-Q2 2022.
Footwear retailer Shoe Carnival Inc (NASDAQ: SCVL) kicked off its third fiscal quarter as the 2022 back-to-school season was in full swing. A breakdown of retail and ecommerce spending trends found that Shoe Carnival Inc stores experience a hike in sales during August, corresponding with back-to-school shopping, while the company’s ecommerce sales instead sees their biggest spike during the holidays. When it comes to customer acquisition, most online sales at the footwear company are from new customers, but most retail sales originate from returning customers.
Although few consider the northeastern states a prime fast-food destination, foot traffic data reveals that QSR visits are skyrocketing in New England and New York, with regional growth significantly outpacing the nationwide average. While the data doesn’t fully capture deliveries, drive-thru visits, or online order pick-ups, the data can still provide a sense of the regional strength of the category.
As inflation continues to strain consumer budgets and retail sales, Labor Day Weekend presented a chance to grab last-minute back-to-school and early-bird holiday deals. Though shoppers remained budget-conscious, there are strong indications that these concerns are beginning to subside. We dove into the foot traffic data across multiple retail categories to take a closer look at the shift in discretionary spending ushered in by Labor Day 2022.
In Q2, Apptopia's mobile data identified leading indicators and trend shifts in tickers weeks ahead of consensus for a number of stocks, as mobile performance correlates with company key performance indicators. As our team has worked alongside investors to uncover correlations that can help predict earnings outcomes, we find cases every quarter where the nuances to mobile performance metrics make all the difference. For example, when Netflix went after password-sharing, it impacted the metrics that mattered.
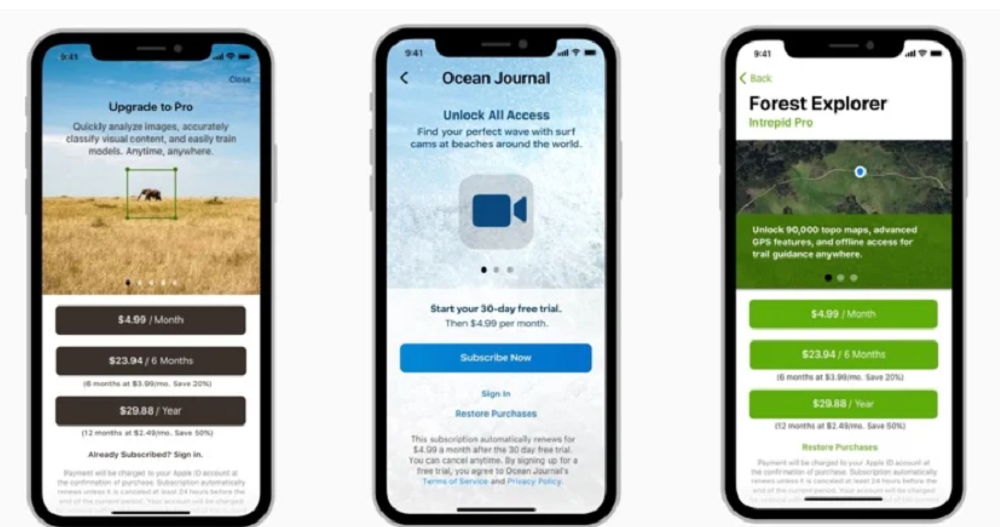
The average price of an in-app purchase (IAP) in the U.S. on the iOS App Store has increased 40% year-over-year (YoY) in the month of July. That number is 9% on the Google Play store. With the Consumer Price Index up 8.5% YoY, people are seeing prices rise almost everywhere. Apptopia data has been tracking consumer behavioral shifts due to these rising prices, and we now see the app stores are no exception.
Our most recent white paper takes a closer look at the ripple effects domestic migration can have on local industries. We examined how office buildings, grocery stores, smaller cities, and even restaurant preferences are reacting to seemingly small fluctuations in local demographics. We explore one such change below. For in-depth insights into the way domestic migration can shape an industry.
Although summer is not even over, many skiers are already looking forward to slope season. In today’s Insight Flash, we look at Epic Annual Pass sales for MTN over the last three years to show how our data can be used to interpret the upcoming surge in spend. We look at the overall seasonality in higher tickets, spend by customers traveling in from different regions, and how often annual passholders skied last year.
There is Fast and Furious when it comes to the ride-sharing business. Here’s an update on the ride-sharing race between the two biggest companies in Southeast Asia: Gojek versus Grab for the first half of 2022. After the past challenging years for mobility amid the pandemic, both companies have seen some rebound in ride-sharing business in Indonesia, Southeast Asia’s largest market. What’s the score now?
Back to School 2022 brought significant pressure to retail. There was a real impression that the post-pandemic environment’s first true retail season could provide a needed boost for chains across the sector. Yet, the onslaught of economic headwinds presented a uniquely difficult scenario that proved to be a formidable challenge for brick-and-mortar retail visits. But the season was not all struggles and, in fact, presented hope that the coming months could already be providing a needed shift.
Quick Commerce has enjoyed rapid growth over the past couple of years, with nascent organisations enjoying sizeable valuations. Getir was valued at $12bn in March 2022 in their Series E; Gorillas was valued at $2.1bn in October 2021 in their Series C, and Zapp has raised over $300m. Whilst the volatile economic environment is challenging some of these valuations, one thing is for sure, Q-Commerce organisations are shaking up the Grocery landscape and the incumbents need to have a clear and fast strategy on how to manage this strongly emerging threat.
The Dodge Momentum Index (DMI) ticked down by 1.2% in August to 171.9 from the revised July figure of 174.0. The Momentum Index, issued by Dodge Construction Network, is a monthly measure of the initial report for nonresidential building projects in planning, shown to lead construction spending for nonresidential buildings by a full year. In August, the commercial component of the Momentum Index rose 1%, while the institutional component fell 5.6%. Commercial planning in August was led by an increase in hotel projects, while fewer healthcare projects drove the institutional component lower.
With many US companies finally mandating a return to the office after Labor Day, some companies that have continued to ride the remote work wave may see sales slow. In today’s Insight Flash, we look at the impact working from home has had on direct delivery coffee companies, seeing how incumbent Nespresso has fared versus newer brands in terms of spend growth, retention, and new customer acquisition.
As college football kicked off in the U.S. on August 27, the top 5 Sports Betting apps did too, accumulating half a million downloads through Labor Day. This combined new install count among DraftKings, FanDuel, BetMGM, Barstool, and Caesars is up 39% from the same period last year. Barstool Sportsbook's daily downloads grew the most between the two weeks, reaching a 329% increase on Sunday. Its growth slowed Monday, while second-fastest grower FanDuel continued to pickup, and the two apps met at 257%.


