Employee morale has taken a significant hit since the onset of the pandemic. In fact, in a previous newsletter, we found that the greatest predictor of employee satisfaction was Workplace Culture, followed by Career Opportunities and Work-Life Balance. But instead of looking at companies, this week we look at what cities have the most satisfied workforces.
In the early days of the pandemic, amidst the lockdowns, population exodus, and mounting daily COVID cases, many predicted that New York City was finished. But as it turns out, it takes more than a global pandemic to destroy the city that never sleeps. Using foot traffic data, we dove into recent retail, tourism, and migration patterns for Manhattan and Brooklyn to understand how the past two years have impacted these iconic urban hubs.
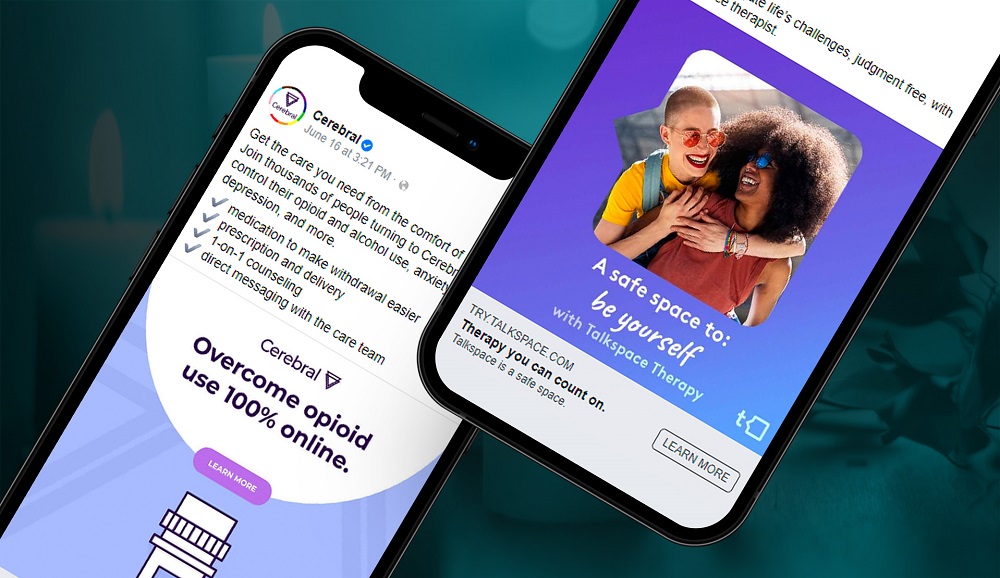
In today’s difficult and unprecedented times, taking care of our mental health is more important than ever. With online mental health therapy services like BetterHelp, TalkSpace and Cerebral, consumers have a variety of options to meet with a therapist and support their mental health anytime, anywhere. We took a look at how these services have adjusted their ad spend throughout 2022 so far, and may continue to shift their spending with current events.
During the first six months of the year, the value of commercial and multifamily construction starts in the top 20 metropolitan areas of the U.S. increased 24% from 2021, according to Dodge Construction Network. Nationally, commercial and multifamily construction starts increased 18% year-to-date. In the top 10 metro areas, commercial and multifamily starts rose 28% in the first six months of 2022 compared to that of 2021.
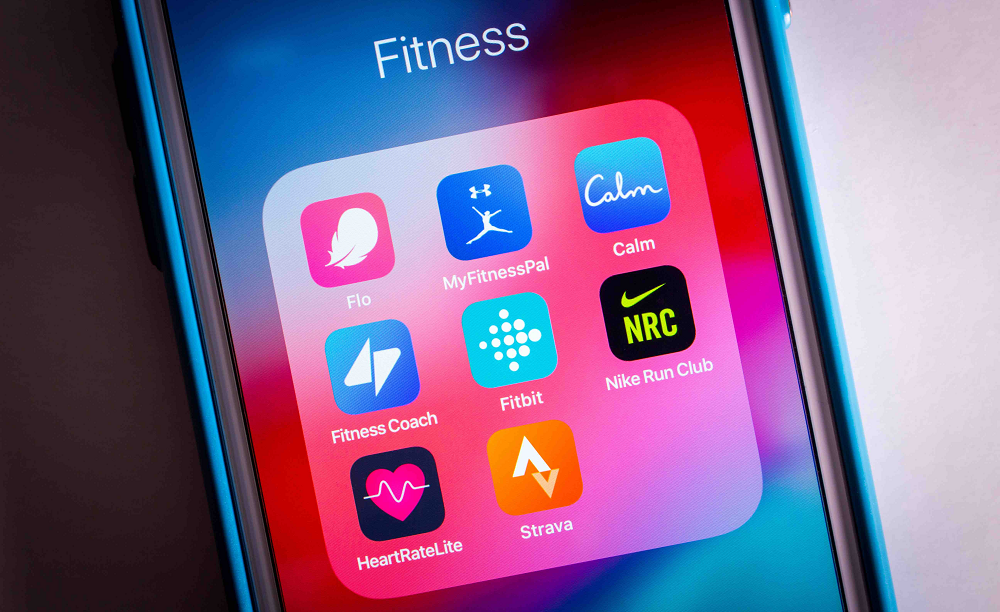
In its first appearance on our download leader charts, Sweatcoin is the most downloaded Health & Fitness app in H1 2022. Flo Period and Ovulation Tracker held the top spot for the full year 2021, but is losing its grip globally and, in particular in the U.S., as the Roe v. Wade decision surfaced mainstream media conversations about Flo's not-so-distant past sharing sensitive user data.
It’s known that millennials love their furry companions after it was confirmed that 58% of millennials said they’d prefer to have pets over human children. Even more, the same survey revealed of 1,000 pet owners that 57% of pet parents love their animals more than their siblings. The trend doesn’t stop at millennials, either. In 2020 70% of US households owned pets, an all-time high. With many seeking some form of companionship, people turned their attention to their fur babies, spending more on them than ever before.
While the calendar shows that the summer of 2022 is pushing toward its conclusion, travel season remains in high gear around the U.S. Aligned with that season, the latest four-week “bubble” charts from STR show that leisure-oriented travel remains the predominant force behind the top performing U.S. hotel markets. For the four-week period ending with 16 July, Oahu led the Top 25 Markets in average occupancy (84.2%) with a conspicuous boost during the Fourth of July holiday—the same period when most markets saw expected and significant demand declines.
With summer blockbusters attracting moviegoers back to the box office, consumer transaction data reveals that U.S. sales for AMC Entertainment Holdings (NYSE: AMC) in June 2022 tripled compared to the same month last year. Our analysis further shows that the movie theater chain’s sales and average monthly sales per customer are higher than they were prior to the pandemic.
As inflation spiked in the first half of 2022, grocery shoppers nationwide felt the pinch at the checkout. We conducted a regional analysis of grocery foot traffic data to examine the effect inflation is having in various markets and recapped Q2 2022 visit data for the category as a whole to offer a forecast for the coming months. Inflation remains at the forefront of retail news, with the consumer price index (CPI) jumping 9.1% in June – representing the highest level in almost 40 years.
McDonald's leads all Food & Drink apps in new installs for the first half of the year by a healthy margin, beating out its top contender in Uber Eats by 70%. Looking back at the full year 2021 app download leaders, it was also McDonald's which led the pack. In addition to the Food & Drink category leaders, we've also posted the overall download leaders for H1 2022.
Our last check-in with Kohl’s in January analyzed the likelihood of continued recovery for the chain’s in-store visits. As the Back-to-School season ramps up, we thought it a good time to revisit the brand’s foot traffic and look at what steps Kohl’s is taking to maintain its position as a major player in the department store space. Kohl’s potential for a comeback is fueled by the brand’s strong position in the department store space.
It’s been more than a decade since “Satoshi Nakamoto,” a suspected pseudonymous person or persons, introduced Bitcoin—and cryptocurrency—to the world. In that time, its value has skyrocketed from zero to $60k, turning thousands of ordinary people into millionaires, a lucky few into billionaires and a long list of others into oh-so-comfortable. In 2021, the cryptocurrency market was valued at more than $3t, which came at a time when many coins reached all-time highs and crypto started to gain widespread appeal, especially among corporations and governments.
Although temperatures have been rising, the housing market has been cooling. In today’s Insight Flash, we focus on how to use our CE Web webscrape dataset to catch the inflection points of when the downturn started and when it might reverse, looking at leading indicators of sales and changes in ASP at the state level. CE Web captures listings on the Opendoor and Offerpad websites, with the removal of a listing usually a leading indicator of a pending sale.
Earnest Research transaction data captures consumer credit and debit card activity across thousands of companies and dozens of categories. As a result the data paints a picture of total consumer spending on most goods and services. See methodology note at the end for wallet share calculation explanation. Consumers spent over 6% of their total monthly wallet at Big Box retailers such as Walmart and Target in June 2022, followed by Supermarkets (Kroger, HEB, Publix, etc.), Online Marketplaces (Amazon, eBay, etc), and Gas Stations.
According to recent reports, Starbucks is looking to sell its UK business. Although sales have recovered somewhat with offices reopening, does lower loyalty in the UK versus the US pose a problem? In today’s Insight Flash, we compare trends in the US versus UK, loyalty metrics, and cross-shop to dig into the company’s performance across geographies. Looking at spend versus pre-pandemic levels, Starbucks UK growth is very similar to US growth.
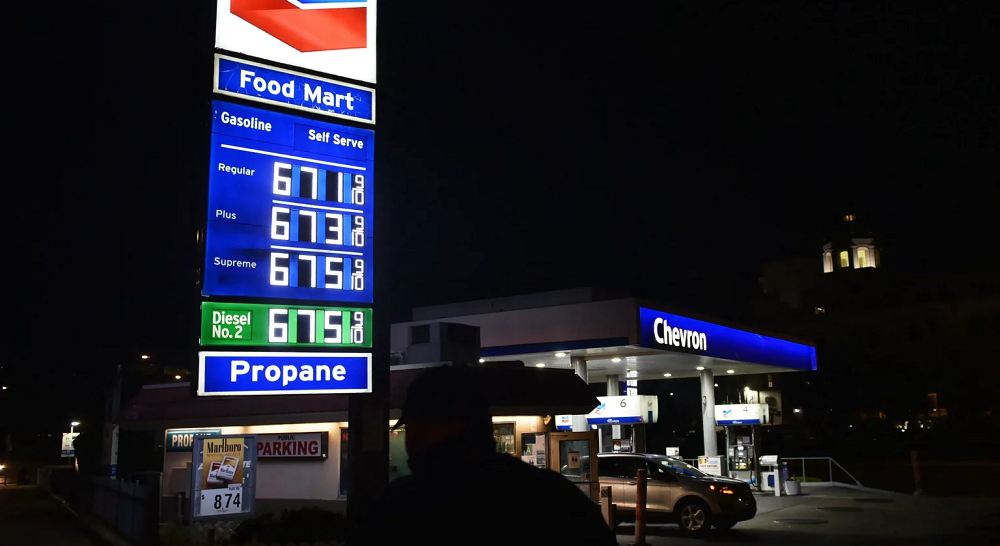
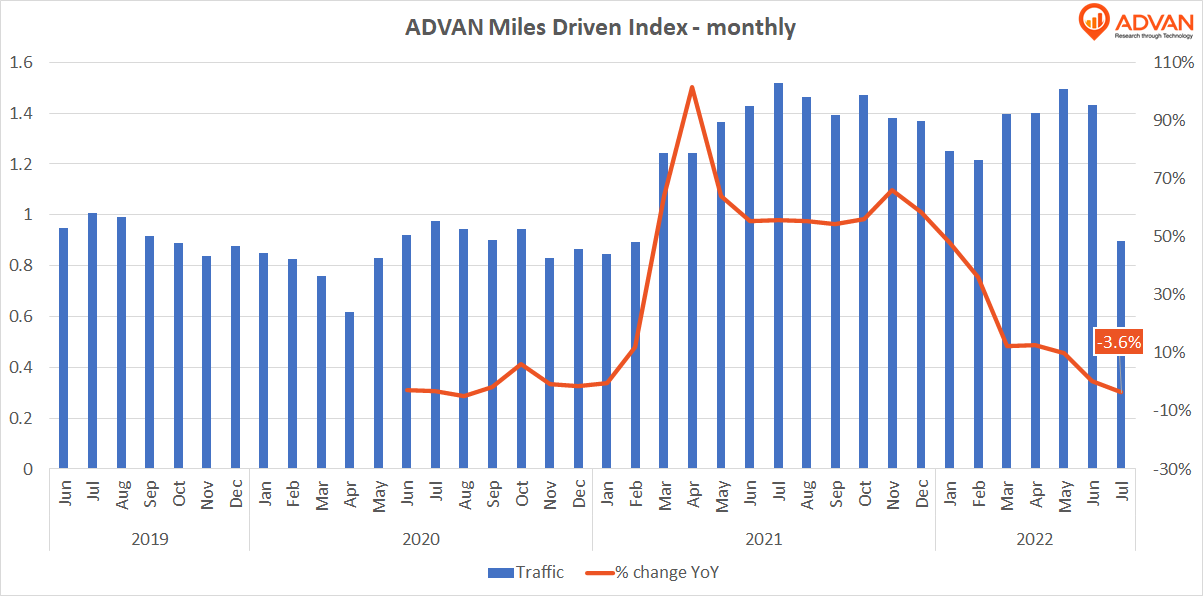
Historically, gas demand has been pretty predictable for any given time of the year, so the supply has been what mostly determined the pricing we see in the pumps. With the advent of remote working and as a result the ability to commute less, however, Americans have at least one lever to reduce the amount of gas they purchase. The other major aspect of the demand of course being leisure travel.
In this Placer Bytes, we take a look at the offline performance of two restaurant leaders, McDonald’s and Chipotle, to see how they’ve fared in Q2 2022. McDonald’s has long been an industry leader, with over $23 billion in sales in 2021. The fast food giant has the most locations of any restaurant in the country after Starbucks and Subway, even though it has been shrinking its store fleet in recent years. But despite its smaller physical footprint, the QSR leader has seen its year-over-year (YoY) and year-over-three-year (Yo3Y) visit numbers grow in recent months while outpacing foot traffic trends to the wider QSR category.
In recent weeks, news of airlines cancelling flights and images of long queues at European airports have dominated mainstream media, with many travellers reported having missed their flight due to lengthy delays even after check-in. To shed light on how bad the situation really is, ForwardKeys has taken a closer look at air traffic disruption by analysing recent cutbacks in capacity around the world.
When considering a job offer, applicants negotiate perks, work hours, start date, health or retirement benefits. Perhaps most importantly, there is the common practice of negotiating a higher salary. But how much room do people really have when negotiating their salary? Can they get 5% above the offer? Or even 50% more? To explore this question, we examine the differences between offered salaries (proxied by the salaries announced on job postings) and the actual salaries that employees receive (salaries that employees report on job review websites during or after employment).
Last year’s Back-to-School season coincided with the wider post-vaccination brick-and-mortar reopening and the timing drove exceptionally high foot traffic as consumers flocked to their favorite stores to spend their savings from the previous year. This year, the retail landscape looks quite different, with shoppers looking to stretch their budgets and avoid unnecessary expenses in the face of rising inflation. Still, students need books, school supplies, and dorm decor and kids need new clothes as they grow. We dove into the data to find out which brands are particularly well positioned to benefit from this year’s Back-to-School season.


