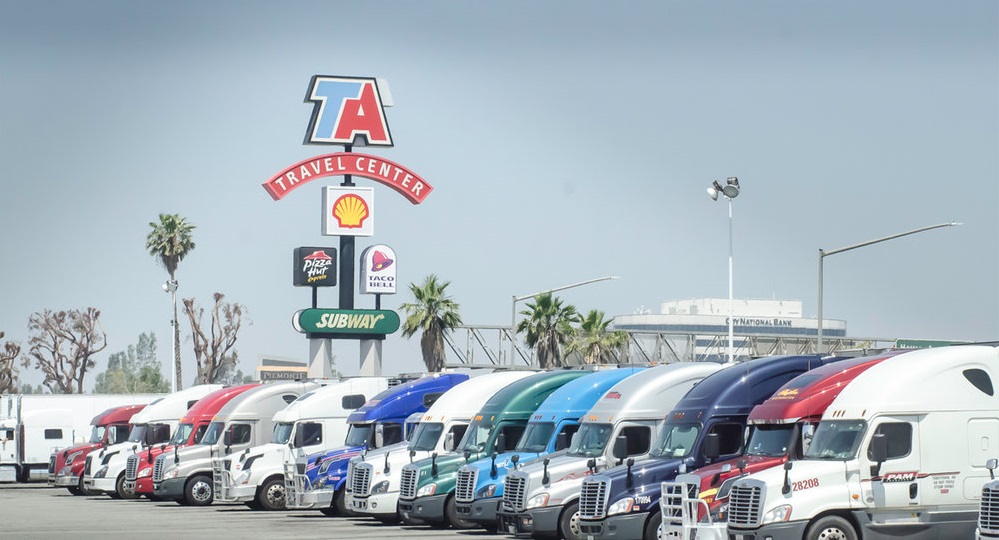
A recent article on Wall Street Journal by Peter Grant took an insightful look at how truck stops in the US have been boosted this year, in part due to the increase in demand for e-commerce and delivery. TravelCenters of America (NASDAQ: TA), the largest publicly listed operator of truck stops in the US, saw its share price increase 50% following its quarterly earning announcement in early August.
Mobility data mapped against new cases of Covid-19 across Paris and London since the start of the year reveals a startling link between population mobility, and the spread of the virus. When set alongside one another, population mobility within cities shows a strong inverse correlation with the number of new cases being identified. Cases rising when populations are more mobile, and decrease rapidly when movements are reduced.
The nation’s overall delinquency rate was 7.1% in June. All states logged annual increases in both overall and serious delinquency rates in June. In June 2020, 7.1% of home mortgages were in some stage of delinquency (30 days or more past due, including those in foreclosure), slightly lower than the May 2020 rate of 7.3%, but a 3.1-percentage point increase from June 2019.
Upward mobility is a huge concern, not just for ambitious employees, but for the workplace environment. By analyzing cohorts of employees from 1990 to 2018, we see a significant gender seniority gap that seems to be becoming smaller for younger cohorts.
The growth in visits to Restaurants over the course of August is plateauing, with the Huq Index for Restaurants & Pubs falling 17% from its recent high at the end of the Chancellor’s ‘Eat Out to Help Out’ scheme. Has the boost delivered by the scheme produced a lasting result? How will recent gains continue over the coming weeks without the same levels of government support? Over 100m meals were bought through ‘Eat Out to Help Out’ in August, and Monday-to-Wednesday became the new ‘weekend’ for many restaurants.
Everything in retail has been turned upside down in 2020, so it’s exciting to see something continue as normal. Obviously, we’re talking about the unique power of Starbucks to leverage the calendar to its fullest advantage. And while even this success requires COVID-era context, it still emphasizes a strategic approach that will guide the success, or lack thereof, for many retailers in the coming months.
In this Placer Bytes, we break down the sustained success of Kroger, the recoveries of Casey’s and GameStop, and analyze what Dave & Buster’s struggles mean for experiential. We’ve spoken ad nauseam about the strength traditional grocers have shown amid the pandemic and recovery. And have also dedicated a great deal of time to discussing the changes in customer visitation patterns.
Starting in March, schools started sending students home—and many aren’t going back this fall. This is creating a strange back-to-school season, putting stress on retailers. How have the changes impacted retailer advertising?
With rising infection rates and concerns about the looming virus season, the COVID crisis is clearly far from over. But with the first wave behind us, it is possible to see the past six months of market volatility in its broader context. The S&P500 is now higher than it was in February 2020, having at one stage lost one third of its value. The VIX spiked from a mid-February level of 14% to a mid-March high of 85%, and currently trades at 33%. The Global BBB spread\[1\] tripled from 1.5% to 4.5% and currently sits at 1.7%.
The first full week of September capacity follows the recent trend and we are now into the fifth consecutive week of capacity declines from what looks like the peak capacity week of the 3rd August. Project the current trend forward to the year end and global capacity will fall below 40 million in the last week of December; that will not be a happy Christmas for the airline industry. The last full week of December 2019 saw some 106.8 million scheduled seats, so we appear to be heading for less than half of global capacity by year end.
The Dodge Momentum Index increased 1.8% in August to 126.5 (2000=100) from the revised July reading of 124.2. The Momentum Index, issued by Dodge Data & Analytics, is a monthly measure of the first (or initial) report for nonresidential building projects in planning, which have been shown to lead construction spending for nonresidential buildings by a full year. In August, the commercial component rose 3.3%, while the institutional component moved 1.2% lower.
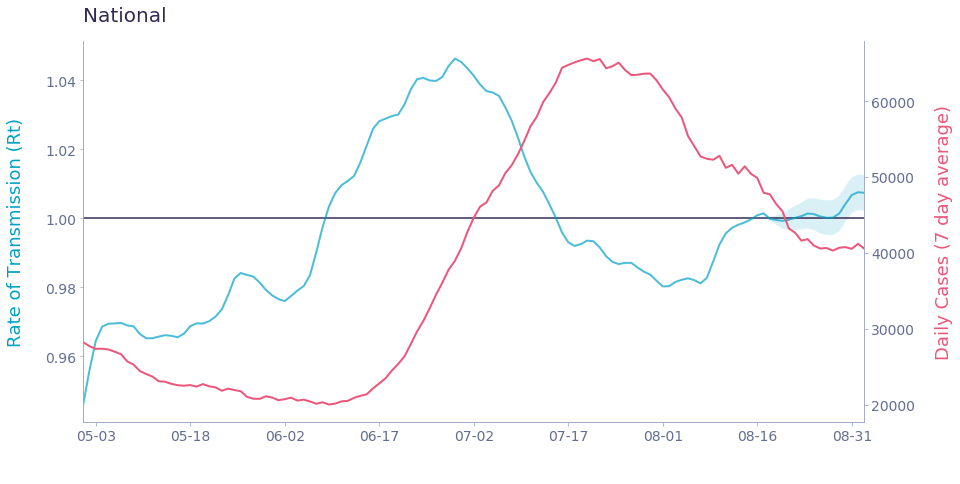
There are some regions with modestly elevated illness transmission – Southern California, for example – but no states are showing alarmingly high rates of illness spread. At a national level, Rt has leveled off around 1 for the past few weeks, suggesting that we will not see major changes in case numbers in the coming weeks.
Car factories across Europe have recovered two-thirds of their 2019 productivity during July and August, with worker presence at these locations doubling post lockdown. Huq’s Big-6 Industrials Index, which measures footfall to more than 750 of Europe’s production facilities across Defence, Biotechnology, Chemicals, Automotive, Aerospace and Food Production, has seen activity at car manufacturing facilities increase from around 33% of last year’s levels to almost 70% over the summer.
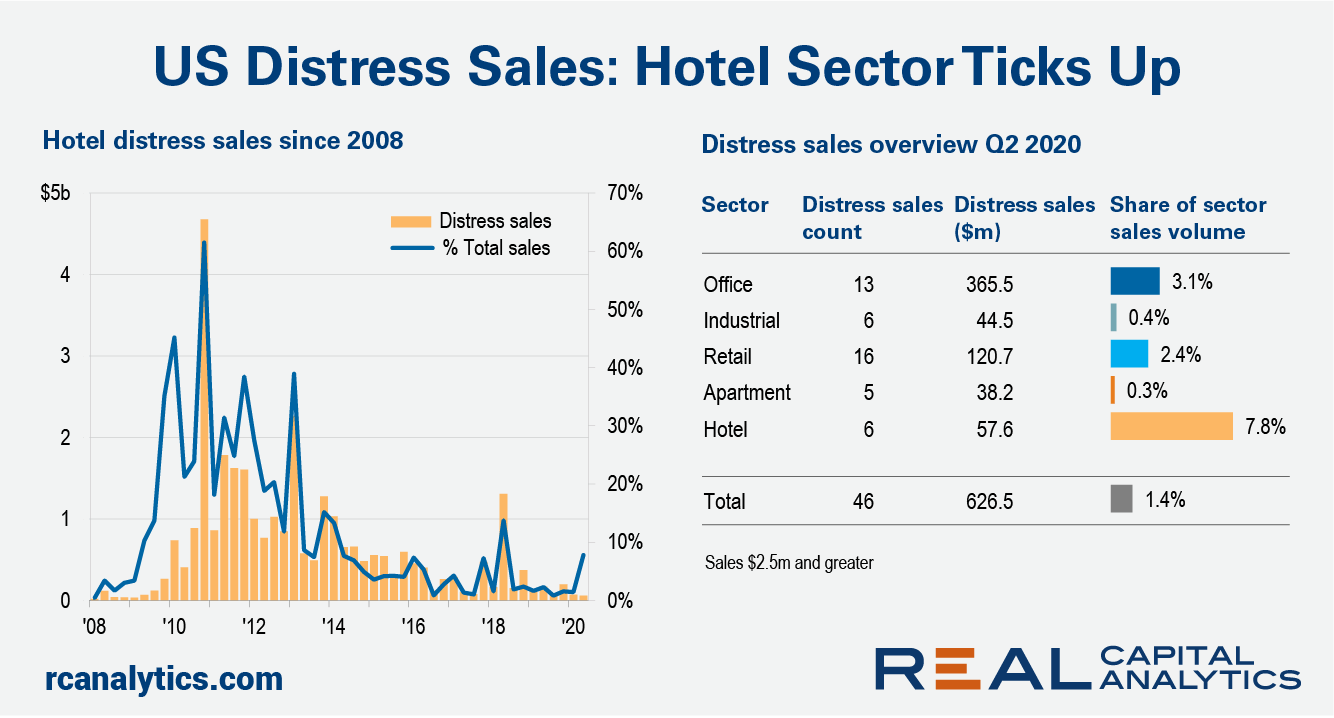
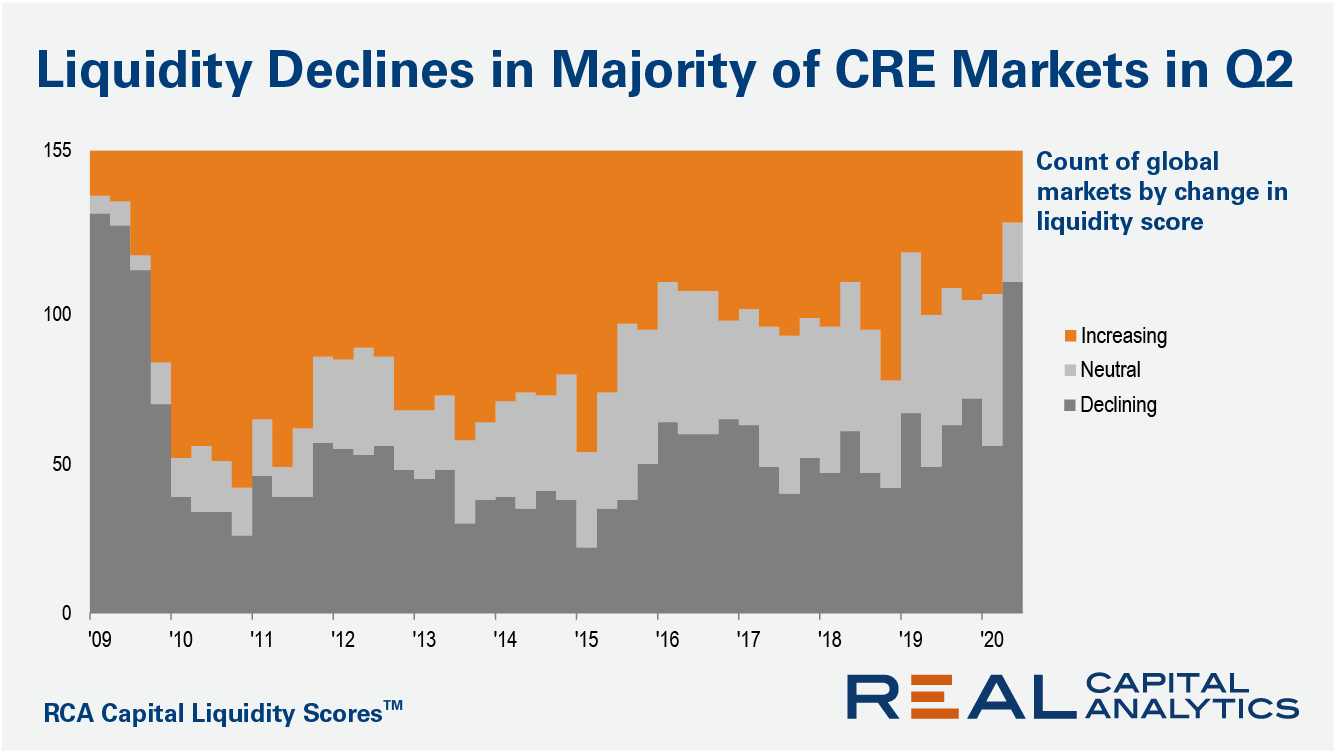
Rising distressed sales of commercial properties can be the push that topples commercial property prices, but with the exception of the hotel sector, such activity is still a small portion of the U.S. market. The economic calamity from the Covid-19 crisis has changed investor perceptions of prices with few still willing to step up to the high pricing set before the upheaval.
With COVID-19 disrupting businesses throughout the nation, there is reasonable concern regarding the impact of the pandemic on construction trends. Every quarter, CoreLogic publishes the Quarterly Construction Insights report, which digs into critical pieces of the construction economy in the U.S. and Canada, such as changes in material and labor costs, permits for new construction, and construction employment. Here are some of our key findings for Q2 2020.
As expected, during the initial lockdown in March and April, customer spending on online bookings fell dramatically for Airbnb and the hotels studied (Marriott, Hilton, InterContinental). From April 27 to the beginning of June, spending climbed quickly for these companies. Airbnb rose the fastest with an average of 32% week-over-week growth.
The struggling meal kit industry has flourished in the COVID-19 era. Whereas industry sales had previously fallen 6 percent in July 2019, the industry has gained tailwinds a year later, growing an average of 105 percent in July 2020. As shelter-in-place orders left many Americans with extra time for home cooking, a closer look at meal kit companies operating in the U.S. reveals that not all companies benefited from the lockdown demand surge.
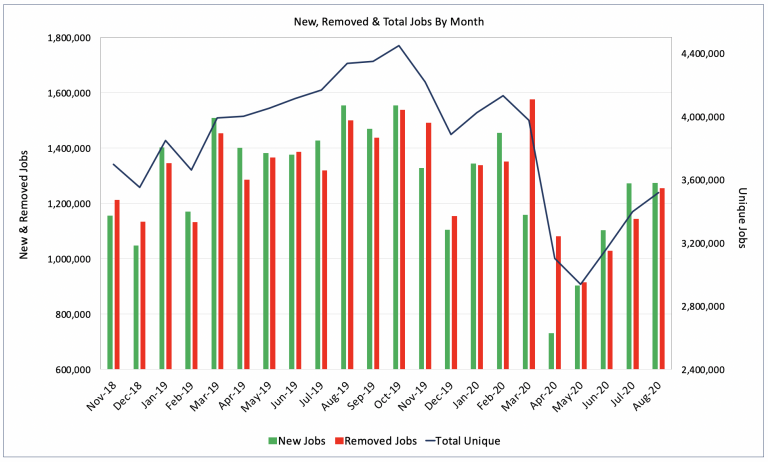
Labor demand continued to rise in August, with steady gains in total, new and removed job openings across the U.S. that continued the steady gains seen in June and July. The LinkUp 10,000, a metric that measures the job openings for the 10,000 global employers with the most job openings in the U.S. for the month, rose 3.6% in August.
Fourth quarter is quickly approaching—meaning holiday advertising is gearing up. But this year’s final advertising push will be far from normal. We’re already seeing the release of the first ads fusing Christmas and the ongoing pandemic. Frito Lays leaned into pandemic-driven cultural changes with its Christmas spoof celebrating NFL kickoff.
Market liquidity fell in 111 of 155 global commercial real estate markets in the second quarter of 2020, according to the midyear update of the RCA Capital Liquidity Scores. The count of markets posting lower quarter-on-quarter levels of liquidity is the worst since the Global Financial Crisis.