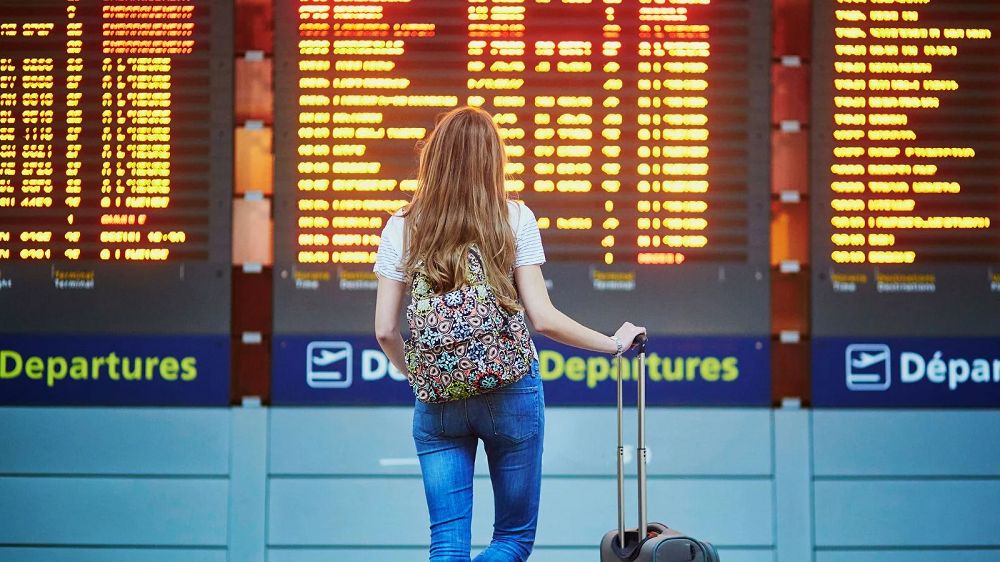
The past two weeks have seen a surge in cancelled flights at European airports, culminating in highly visible cancellations at the weekend (4-5 June). The UK saw 4% of flights cancelled on Saturday 4th June, while the Netherlands saw cancellations rise to 11% on the same day. Cancellations also rose from French and Spanish airports over last weekend, although this may simply have been the repercussions of cancellations elsewhere.
Global airline capacity bounces back this week with airlines scheduling 95.2m seats. Having seen airline capacity reach above 90m seats last week, which felt like a positive step forward, this week’s total capacity represents a definite leap. Only one country market can have such an impact in just one week and that is China, where the re-opening of Shanghai from 1 June has triggered a big increase in capacity, with totals for North East Asia increasing week on week by a quarter or 3.4m seats.
A recent analysis from data.ai shows that the usage of travel and navigation apps has steadily increased since January of this year with app downloads increasing YoY amongst the top 5 travel apps in 3 different app subgenres — highlighting the fact that American consumers are eager to travel regardless of inflation concerns. In fact, more than 80% of American adults are planning summer travel. In addition, research from the US Travel Association found that Americans spent $95 billion on travel in March of 2022
Target (NYCE: TGT) announced today that it expects lower profit due to high inventory. It is counter-intuitive, but cellphone location data is measuring this discrepancy by monitoring Target’s supply and demand sides. On the demand side, in the image below we can see foot traffic in Target stores (in blue) and its associated blue trendline being relatively steady, at a 3% Y/Y increase vs same quarter last year, and closely following the revenue y/y change
Looking at Mall Index visits between April and May showed a clear pattern of expanded visit gaps for all three segments. And while this is certainly not ideal, it does also demand context. The comparison for malls, outlet malls, and open-air lifestyle centers in May compares to a much more significant peak than in March or April. So while elements like inflation and gas prices are likely playing a role here, the relatively minimal increase in the visit gap indicates that this role has been far more muted than might have been otherwise expected.
The Dodge Momentum Index (DMI) jumped 7% in May to 176.2 (2000=100), up from the revised April reading of 165.2. The Momentum Index, issued by Dodge Construction Network, is a monthly measure of the initial report for nonresidential building projects in planning shown to lead construction spending for nonresidential buildings by a full year. In May, the institutional component of the Momentum Index rose 9%, and the commercial component increased 6%. May’s increase in the Dodge Momentum Index pushed the level of planning above the most recent cyclical high in November 2021.
In mid-May, food delivery service Grubhub and its subsidiary Seamless offered a “free lunch” promotion in the NYC area, giving diners $15 off orders between 11AM and 2PM. Many reports labelled the promotion a logistical disaster, citing customer complaints of long wait times and cancelled orders due to overwhelmed restaurants and drivers. But did it drive sales? In today’s Insight Flash, we use our unique ability to see the actual day a transaction was charged to a user’s payment card in order to examine behavior in the NYC CSA during the promotion.
At Apartment List, our research team is committed to providing accurate and timely data so that those interacting with today's quickly changing housing market can make well-informed decisions. For years, our Monthly Rent Estimates have equipped researchers, journalists, industry specialists, and the general public with data on the latest pricing trends. Today, we’re thrilled to announce the release of our newest data product -- the Apartment List Vacancy Index.
Memorial Day barbecues are back and better than ever — and so are the ads. Food and beverage brands are firing up their social media accounts and serving up ads for tasty snacks and refreshing beverages to kick off the start of summer. And with nearly 60 percent of Americans grilling over the holiday weekend, advertisers who get their channel strategy and creative messaging right have a lot to gain. Let’s look at how three of the top advertisers in the Food & Beverage category — Hershey’s candy, Frito-Lay, and Blue Moon — spent their digital advertising dollars from the beginning of May through Memorial Day.
A couple of years—and variants—later, the world appears to be going back to normal and people are understandably excited about the ability to travel. On June 1, 2022, 1.9mm people went through TSA, which is in line with pre-pandemic numbers. Travelers aren’t the only ones excited, though. Advertisers in the travel industry, including U.S Tourism, Rental Car, Lodging and Airlines, are looking forward to clawing back some of the $2 trillion in lost revenue last year.
Summer vacation is around the corner, and consumer demand for travel has picked up again. Chip shortages have driven up the price of new and used cars, while gas prices have reached historic levels and contributed to soaring airfares. The rental car and car sharing industry has also typically seen higher sales in the summer months, and the shortages that plagued last year’s summer travel are expected to continue this year. As we enter the new summer season, consumer transaction data shows that among major car rental and car sharing services, Turo—which filed for an IPO earlier this year—has seen the most growth in sales and customer counts over the past three years.
Snapchat started as a messaging app for close friends and has since evolved into a hub for users to stay up to date on the latest news and discover brands. Pathmatics now tracks and breaks out Snapchat advertising insights, which reveals that advertisers in the United States spent more than $250 million on the app in April 2022—and an average of $238 million each month between January and April. In our latest report, The State of Snapchat Advertising in the U.S., we analyzed Snapchat’s top 10 advertisers by digital ad spend and examined the Telecom, Food & Drinks Services, Sportswear, and Gaming categories.
As companies have been reporting earnings recently, many have noted weakness in low-income spending, even as higher income groups have remained less impacted by recent macro pressures. With gas prices rising and no stimulus checks on the horizon, it is unclear how long this low income weakness will last. In today’s Insight Flash, we take advantage of our unique household demographic data to better understand where a low income pullback in spend will have the strongest impact.
Well past the second anniversary of the pandemic, business travel is showing its first significant signs of recovery. As that recovery gains momentum, a new landscape has formed with the presence of both traditional and new forms of business travel. Amid this new landscape, however, there remains mixed consumer sentiment toward business travel as well as a large gap between current volume and pre-pandemic comparables. STR’s consumer research from May 2022 produced telling insights into this always popular topic.
As demand for consumer electronics softens, it’s no surprise that Best Buy saw visits and sales decelerate this quarter. According to the company’s Q1 2022 results, U.S. comparable store sales declined 8.5% year over year (YoY) and U.S. online sales decreased 14.9% YoY. Nevertheless, two things stood out to us from the quarter: (1) the shift to a higher average selling price helping to offset inflationary pressures; and (2) encouraging trends from new retail formats.
Any home loan that doesn’t comply the Qualified Mortgage (QM) rules is referred to as non-QM. The Dodd-Frank Wall Street Reform and Consumer Protection Act imposed an obligation on lenders to make a good-faith effort to determine applicants have the ability to repay a mortgage, which is known as the ability-to-repay (ATR) rule. The act also mandates the QM cannot have risky loan features like negative-amortization, interest-only, balloon payments, terms beyond 30 years and no excessive points and fees. The QM must also satisfy at least one the following criteria:
Today Klarna announced a physical debit card available in the U.S., expanding its “Pay in 4 service” offline and in direct competition with credit cards. The buy now, pay later leader had its highest amount of monthly active users worldwide in May, proving that it has deep relationships with shoppers, as it heads to another channel. In the U.S., Klarna's performance dominates the rest of the industry, and the Klarna Card is strategic to help keep mobile growth above the rest.
Since work-from-home became more than a short-term pandemic solution, companies have started offering remote positions in an attempt to attract and retain talent. A popular opinion has even emerged that it has become much harder to fill in-person positions. However, when we investigate this claim, we see that while that was previously true, in-person jobs are now increasingly easier to fill.
Our latest whitepaper explores five retailers who have stayed relevant over decades of changing shopping habits. The oldest retailer in our report, Macy’s, has consistently kept their finger on the pulse of shifting consumer preferences and adapted their brick and mortar strategy accordingly. We dove into one of the brand’s latest innovations – the off-price shop-in-shop concept Macy’s Backstage – to understand how incorporating Macy’s Backstage into existing Macy’s locations was boosting visits to the department store.
It’s not everyday that advertisers aren’t chomping at the bit to hand YouTube their ad dollars—but that’s precisely what’s happening as Home Goods advertisers opt for retail media in lieu of the video giant. In Q1 2022, Home Goods advertisers spent $187mm on ads on retail sites like Amazon, Walmart, Target, Kroger and The Home Depot. Meanwhile, they spent just $77mm on YouTube ads.What does their penchant for retail media tell us about their overall digital advertising strategies? Do these advertisers see a future with YouTube—and can we predict anything about their strategies moving forward?


