Before the impending IPO of GoTo Group, it’s about time to update the latest market share of Southeast Asia’s biggest super apps: Gojek and Grab. At Measurable AI, we build and own a unique consumer panel and are the largest transactional email receipt data provider for the emerging markets, delivering both aggregated and raw data. In our previous article, we reviewed the market share of Gojek and Grab’s ride-hailing business across the year of 2021. Our results indicate a close score between the two rivals, with Grab leading by a slight advantage in total revenues in Indonesia last year.
Of the many ways that the pandemic has shifted our habits, one that is especially noteworthy in consumer behavior is how we buy our groceries. When the first wave of the corona virus caused many of us to stay at home, demand for groceries, meals, and other packaged goods delivered right to our door skyrocketed. Prior to 2020, the eGrocery category was a “nice-to-have” rather than a “must-have” for most. It is now growing rapidly—especially with younger generations.
While retail advertising took a hit in early 2020 at the start of the COVID-19 pandemic, ad spend has fully bounced back and reached new heights in 2021. Our new State of Retail Advertising report, available now as a free download, looks at how top retailers in the United Kingdom are adjusting their ad spend and creative strategies in such a competitive and ever-evolving market. Outside of a small dip at the start of the pandemic, investment in Retail advertising has grown steadily in recent years. In 2021, retail advertisers spent $870 million, an increase
Pathmatics data reveals that March’s top 10 advertisers spent more than $136 million on Hulu, Pluto TV, Tubi, Peacock, Paramount+, and other OTT streaming services, with creatives garnering more than five billion impressions. The month’s top three categories were Financial Services, Health & Wellness, and Auto, which ranked in the top three for the first time overall. Let’s see how the top 10 advertisers were spending on OTT in the last month.
Fast fashion retailer Shein made headlines earlier this week with a reported $1B capital raise at a staggering $100B valuation. But is success a shoo-in for Shein? In today’s Insight Flash, we examine how Shein’s market share has evolved in the US and UK, what the average basket looks like versus competitors, and whether return customer behavior signals staying power. Shein has grown quickly to become one of the most popular Fast Fashion brands in the US and the UK.
Around this time two years ago, it was becoming clear that COVID wasn’t going away so quickly. Large corporations and smaller companies that a few months before the pandemic would not have dreamed of allowing work-from-home (WFH), were adjusting to managing a fully remote workforce. And, workers were learning that they enjoyed getting back almost an hour a day that was previously spent commuting while being just as productive.
The COVID-19 pandemic dramatically changed our personal care routines. With many of us spending more time at home and wearing masks when we go out, consumers are swapping out full-face foundation and concealer for serums, oils, and creams. That’s great news for skincare brands, but it’s unclear how this trend will change as normal life resumes. We do know that big skincare and personal hygiene advertisers Curology, Neutrogena, and CeraVe have all been increasing their ad investments since 2021, so let’s see what has changed and just how much they’ve been spending from January through the first week of March 2022.
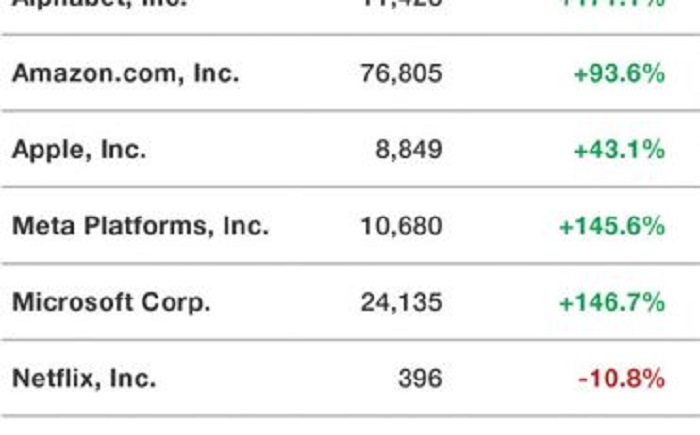
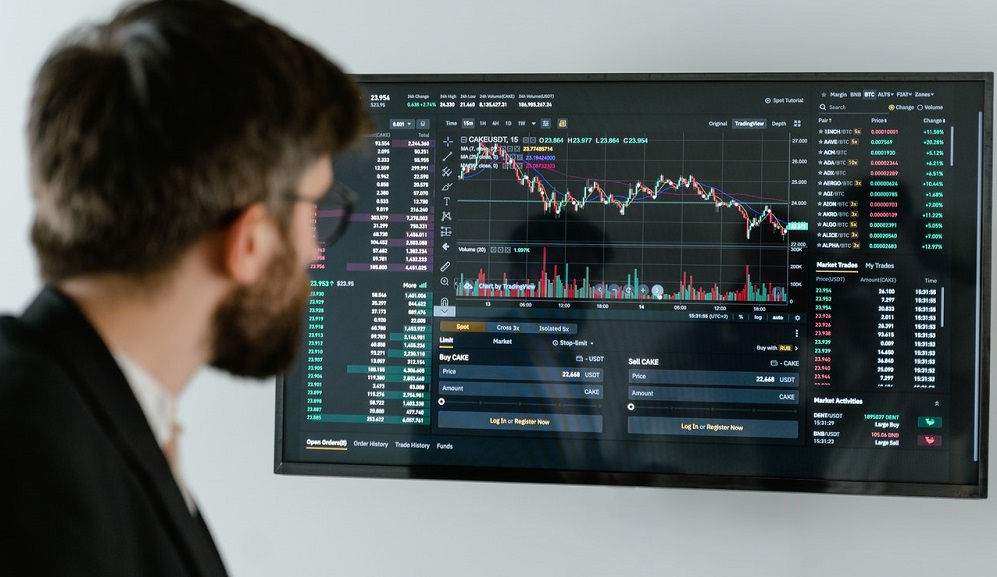
Always, almost annoyingly, in the spotlight, yet undeniably holding our interest — FANG, FAANG, FANGMA, FANGMAT companies. And of course their associated stocks: highly priced, some say overvalued, dominating, and also surrounded by speculation. Right now, FANGMAT = Facebook, Amazon, Netflix, Google’s parent company Alphabet, Microsoft, Apple, and Tesla. FANGMAT includes the five most heavily weighted stocks in the S&P 500, and accounts for over 25% of constituents by weight. And while valuations seem high, portfolios underperformed without them.
Global tourism receipts were well below the pre-pandemic level in 2021 as travel restrictions and uncertainty persisted, and changing consumer behavior dented economic recovery. But now, in the spring of 2022, some two years since COVID-19 forced governments to impose lockdowns and severe travel restrictions, there are plenty of signs of optimism for the future of tourism. This is true even with potential macroeconomic and geopolitical headwinds.
The pandemic has thrust work-from-home into mainstream culture and has had an enormous impact on where people choose to live. Now that companies are looking to bring staff back into the offices, it might prove more difficult than they had once thought. The figure above shows the share of workers residing in a city other than their company’s location. Interestingly, 2021 showed a bit of a reversal in the work-from-home trend, with the percentage of decentralized workers decreasing slightly.
Over the past couple of years, buying second-hand clothes has become mainstream – and the pandemic seems to have given the sector a further boost. We dove into foot traffic of several leading brick and mortar apparel resellers to find out how the rise in thrifting is impacting visits to second-hand stores. The second-hand apparel market in the United States has been growing for quite some time, with consumers citing ethical, financial, and environmental concerns as their motivation for visiting thrift shopping.
As a Global Data Partner of the World Travel Market (WTM), the Head of Market Intelligence, Juan Gomez, has been invited to present at WTM LATAM this week in Sao Paulo on April 6 on the Travel Tech stage. Here are a few points the Head of Market Intelligence shall share in his presentation on the LATAM Travel Outlook for 2022 – to catch the whole presentation and live panel discussion with ProColombia and Emprotur Brazil, make sure you register to attend.
Recent price indexes show that inflation is at a 40-year high. Supply chain disruptions have led to a spike in prices for various goods, which has added to the cost of construction and delayed home completions. Housing is a big part of every family’s monthly spending, so when housing costs go up, it also adds to inflation measurement. Rent is the main way that housing costs enter U.S. inflation metrics. For owner-occupied homes, the government estimates a rental equivalent to assign value to the flow of housing services.
Crypto app installs grew by over 400% year over year in 2021 – but the gender ratio between male and female users has barely moved from 80:20 since the beginning of 2020. I reviewed demographic data from Apptopia's Audience Intelligence for the top 5 Crypto apps in the United States: Coinbase (Exchange), FTX, Crypto.com, Trust Wallet and Voyager. The one moment in time when one of these apps had an active female user base of more than 30% was July through November 2020, for Trust Wallet (owned by Binance).
While the early months of the pandemic were defined by retail restrictions for top performing malls and retail centers, 2021 and early 2022 need to be understood with the wider context of volatility engulfing the space. Visits saw a strong return in the summer, before the Delta variant cut off the growth. Then October saw a boost before November and December were affected by supply chain challenges, inflation and the onset of Omicron.
Spain is among the most sought-after destinations in the world by tourists for this Easter, as highlighted in the presentation of travel forecasts to Spain made last Friday, 1 April 2022 by the Ministry of Industry, Commerce and Tourism and ForwardKeys, the leading global travel intelligence and data company. “The year 2022 has started with a sustained recovery in tourism, as shown by the data from the hotel occupancy survey with 24.1 million overnight stays between January and February, 72% of the pre-pandemic level, or the employment data recorded in February.
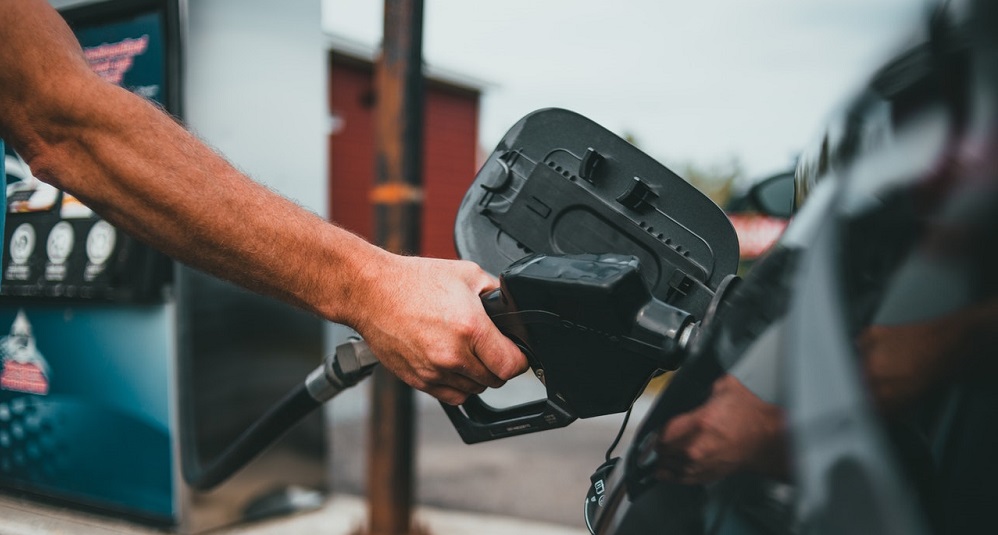
With higher gas prices definitely a pain point for consumers, higher gas prices may fuel concern for retailers. Higher gas prices usually reduce a retailer’s ability to collect margin on the purchase, in addition to limiting funds left in shopper wallets for discretionary purchases. In today’s Insight Flash, we take advantage of Consumer Edge’s unique ability to separate out fuel purchases at gas pumps from other purchases inside the retailer’s store in both the US and UK in order to examine how much the recent price increases have affected the mix of fuel versus ex-fuel sales
BeReal is a social/photo app you designed to share your authentic life with close friends. Year-to-date, its monthly active users have grown 315%. The app launched in December 2019 but 65% of its lifetime downloads have taken place this calendar year. So what it BeReal and why is it different than other social media apps? Much like Dispo, which also launched in December 2019, the app's goal is to get away from detailed curation and professional influencers.
App IQ is the industry’s first comprehensive taxonomy — replacing antiquated app store categories with unparalleled granularity into the mobile ecosystem across 19 genres and 152 subgenres. Our State of Media & Entertainment report is an example of App IQ in action, allowing us to dive deep to uncover nuanced insights publishers need to succeed on mobile
Liquidity fell in some of Europe’s leading real estate markets in 2021 despite acquisition volume on the continent reaching a new annual record, the latest update of RCA’s _Capital Liquidity Scores_ shows. A shift in investors’ sector preference is behind the weaker outturn, and also explains the leap in liquidity in other markets. In Central Paris, liquidity fell by 3% to a four-year low at the end of 2021, and liquidity in Frankfurt dropped to its lowest level since 2014. In Milan, liquidity dropped by 7% year-over-year to its lowest score since 2015.


