COVID-19 will be remembered in history as a pandemic. One of the things it may or may not be remembered for is the mental health pandemic that it induced. Mental Health Awareness Day this year is a stark reminder that, although there is a vaccine for COVID-19, there is no such thing for mental health and personal well-being. And while the need for mental health services has soared, the pandemic halted traditional support and treatment.
In this Placer Bytes, we dive into two classic brands – Dutch Bros. Coffee and Crocs – that have been experiencing a major pandemic boost. Although the dining industry is still struggling to reach its 2019 foot traffic level, Dutch Bros. Coffee has been on an incredible growth streak for more than a year. In the wake of the brand’s [recent IPO](https://www.restaurantdive.com/news/dutch-bros-coffee-targets-33b-valuation-in-ipo/601867/), we took the opportunity to dive into one of the most impressive success stories of the pandemic.
The end of the year is quickly approaching and it’s time to close those final ad sales. Some of the best opportunities can be found in young consumer brands. This is why we’ve analyzed the ad spending of some of the top performing startup brands from this year. These brands were first identified based on LinkedIn’s Top Startups in 2021. We sifted through the consumer brands and identified those that had the best quarter-over-quarter outlooks.
In July 2021, 4.2% of home mortgages were in some stage of delinquency (30 days or more past due, including those in foreclosure), which was a 2.3-percentage point decrease from July 2020 according to the latest CoreLogic Loan Performance Insights Report . However, overall delinquencies were still above the early 2020 pre-pandemic rate of 3.6%. The share of mortgages that were 30 to 59 days past due — considered early-stage delinquencies — was 1.1% in July 2021, down from 1.5% in July 2020.
The CoreLogic Loan Performance Insights report features an interactive view of our mortgage performance analysis through July 2021. Measuring early-stage delinquency rates is important for analyzing the health of the mortgage market. To more comprehensively monitor mortgage performance, CoreLogic examines all stages of delinquency as well as transition rates that indicate the percent of mortgages moving from one stage of delinquency to the next.
The 2021 multifamily bounce back has been like nothing seen in decades. Dazzling apartment demand has propelled lease concessions downward and average rent to stratospheric levels despite an increase in new supply compared to previous years. Of course, beneath the national metrics, some important differences emerge. As always, all numbers will refer to conventional properties of at least 50 units.
Recent major sporting events in different corners of Australia produced differing performance impacts for the respective host markets. Perth realized its strongest revenue per available room (RevPAR) in five years during the AFL Grand Final, while performance during the NRL Grand Final in Brisbane was a bit more held back by COVID-19 restrictions. The AFL Grand Final was historic on two different fronts, with Melbourne FC ending a 57-year premiership drought and accommodation operators achieving their best night since early 2016.
As the wider retail recovery continues, one sector that seems particularly well aligned with current trends is the pharmacy space. An increased focus on health and wellness alongside the ability to distribute COVID vaccines and administer tests has positioned leaders in the space particularly well. CVS and Walgreens returned to year-over-two-year growth by March 2021 with both brands maintaining the success throughout the summer.
The last seven days have felt like things are beginning to get back to some degree of normality. Airlines are once again recruiting for cabin staff, new routes are being announced, more countries are being removed from restricted travel lists around the world and even I’ve escaped the UK! The IATA AGM last week was naturally cautious in tone and, given the industry losses in the last two years, why would anyone expect otherwise and of course, commitments were made on sustainability. So, all good news then…
After rising unabated for the last three months, the average number of daily deaths due to COVID-19 is finally decreasing again. While around 1,800 people are still lost to the virus each day, trends suggest the COVID-19 death rate will continue to fall. The surge in deaths caused by the Delta variant topped out at just under 2,100 deaths per day, nearly the same as the peak during the first wave of the pandemic in April 2020. The 2020-21 holiday outbreak continues to be the most deadly period of the pandemic for the US when the country topped out at around 3,400 daily deaths.
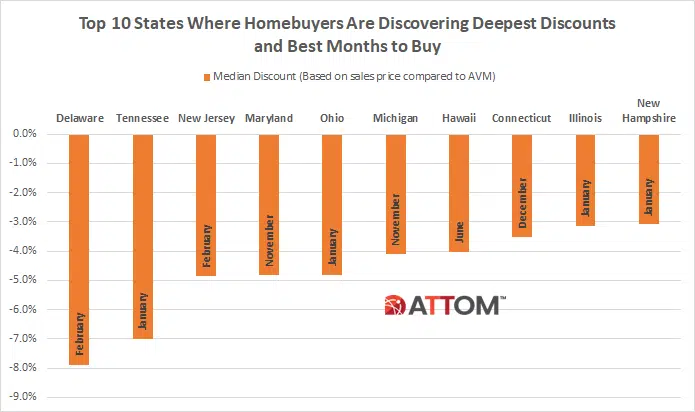
ATTOM’s newly released 2021 analysis of the best time of the year to buy a home reveals that homebuyers are fetching lower premiums during the month of October, as well as the winter months, compared to the spring buying season. The study of more than 33 million single family home and condo sales over the past eight years found that while the premium is still above market value, homebuyers that close in October are only dealing with a 2.9% premium, compared to the month of May, when homebuyers are experiencing an 11.5% premium.
When booking a hotel room, guests are considering more factors than ever in deciding which property to call home in their destination. One of the many considerations is price, and by extension hotel class, which leads us to this latest analysis of occupancy on the books in London. Examining future occupancy levels by class allows for a better understanding of the traveler booking rationale for the upcoming months.
U.S. hotel industry demand retreated in the latest week of reporting (26 September-2 October), failing to align with a rise in TSA security screenings. Normally, we expect an uptick in air passengers to yield an increase in hotel demand. This week was an exception with occupancy slipping 1.5 percentage points to 61.7%. Both weekday and weekend demand sank with 27% of the week’s demand loss occurring on Thursday. On a total-room-inventory (TRI) basis, which accounts for temporarily closed hotels, weekly occupancy was 59.4%. A little more than 48,000 rooms remain temporarily closed, mostly in New York City, Orlando, and San Francisco.
This past May, following a disappointing jobs report for April, we posited that the job market was not afflicted with a labor shortage but rather a wage shortage. In subsequent months, we expanded our argument by laying out the case that the job market was suffering from a massive bid-ask spread between employers and employees. Health risks and economic devastation from COVID were obviously the primary contributors to illiquidity in the job market, but beyond those first-level factors, the pandemic incited what we called in June’s post a ‘stealth revolution.’
2021 is shaping up to be a very different year for investors than 2020. After pulling back their market activity at the onset of the pandemic, investors had a business-as-usual winter, before capturing the highest market share seen in the last 10 years in the second quarter. Figure 1 shows the share of total purchases that were made by investors in each month. 2019 shows the normal seasonal pattern. Investor purchase shares are highest in the winter months when owner-occupied buyers are less active.
Last month we showed that U.S. inflation may be underestimated due to the use of a measure called owners’ equivalent rent, which makes up 30% of the core consumer price index. When the CoreLogic single-family rent index is used as an alternative measure for price changes in owner-occupied housing, we saw core inflation increasing by one-to-two percentage points faster than what was reported from April to July of 2021. The CoreLogic single-family rent index is also available for more than 100 metro areas, which can be used to compute metro-level inflation measures.
CE Web webscrape data provides deep and accurate analysis of the iBuying businesses of real estate websites like OPAD, OPEN, and ZG. In today’s Insight Flash, we show how our new CE Web CE-Q dashboards help users get to insights from the data more quickly, specifically seeing which metrics are growing fastest for OPAD, OPEN, and ZG as well as diving further into how the ratio of resale value to acquired value is trending and what inventory trajectories may say about future growth.
Following what’s trending and trendspotting are not the same. Trendspotters identify the coming trends and capitalize on them early. They stay market leaders. Think about the top brands in the market now. They are the names others turn to prepare for what’s coming. It’s why there is hype around every new iPhone launch. Yet, being on the cutting edge of the industry isn’t just reserved for the current market leaders. By keeping an eye out for industry data, you can anticipate which trends are fleeting (think clubhouse vs. TikKok), and which have lasting power to disrupt your market.
Consumer transaction data reveals that sales for the home improvement industry skyrocketed early in the pandemic as many consumers stayed at home during shelter-in-place orders. A year and a half later, home improvement sales are still higher than pre-pandemic levels, but sales growth at a select group of major hardware store chains did not maintain the same momentum in 2021 as it did in 2020. At the same time, the average transaction value for home improvement companies has increased year-over-year.
Student housing investment volume in the U.S. reached $1.7 billion in the second quarter of 2021. While this level represents a high-triple-digit rate of increase compared with the same period a year ago, it is still 12% below the average level for a second quarter between 2017 and 2019. Sales of student housing assets had ground to a halt in Q2 2020 amid Covid-19 disruption to the commercial real estate market and as universities and students across the U.S. pivoted to remote learning.


