Athleisure surged in 2020 as the pandemic pushed many to re-evaluate their apparel priorities, and sporting goods retailers also thrived as people stocked up on exercise equipment to make up for the absence of fitness centers. Now that gyms and offices are opening back up, we analyzed Nike, Lululemon, and Athleta’s recent visit patterns to understand how these brands performed in 2021 and where the athleisure and athletic wear recovery is heading in 2022.
At the height of the pandemic, there was plenty of discussion about what the response to the pandemic would have been if it had come, say, 20 years ago. Take working from home – a perfectly logical solution to the need for social distancing. But in a time before broadband and video conferencing, this would simply not have been feasible for the vast majority of employees. Similarly, think about mobile apps and their role in the pandemic response. Yes, there may well have been contact tracing and systematic vaccine roll-out plans in the 1990s.
Twenty years ago, CapitalOne appointed Cathy Doss as the first Chief Data Officer. Since then, the world, and especially large companies have become more data driven and the Chief Data (and Analytics) Officer (CDAO) role has become a common member of the C-Suite. In 2002, CapitalOne was ahead of its time. It took another 12 years for the role to truly pick up in popularity. But then it did, very rapidly:
The start of any year is about optimism and a fundamental resolution to make the coming annum fundamentally better than the one that preceded it. And the same goes for retail, where the biggest names in the sector look to set the pace for the coming year. However, beyond the standard challenges associated with retail success, 2022 kicked off with the added obstacles of a rising COVID variant, inclement weather, labor shortages, and continued supply chain and inflation issues.
Amazon’s most recent earnings call brought attention to numerous interesting figures; several that are worth digging into from a job posting perspective. Amazon touches many different sectors, but arguably the most interesting details from the earnings calls were to be found in its eCommerce and web services. When Comparing Amazon to some of its larger peers in the space, it seems to be doing well, with job listing growth outperforming Target, Walmart, and Alibaba.
The Dodge Momentum Index declined 7% in January to a four-month low of 152.9 (2000=100), from the revised December reading of 163.7. The Momentum Index, issued by Dodge Construction Network, is a monthly measure of the initial report for nonresidential building projects in planning, which have been shown to lead construction spending for nonresidential buildings by a full year. In January, commercial planning fell 9%, and institutional planning slipped 1%. The Dodge Momentum Index had a stellar 2021, rising 23% from 2020 and reaching levels not seen in nearly 14 years.
According to Apptopia’s recent analysis Benchmarking the Global Mobile Retailing Landscape, the top 15 direct-to-consumer (D2C) shopping apps grew for the third consecutive year: from 4Q 2020 to 4Q 2021, downloads increased 13.6%. Compared to the other U.S.-specific commerce markets featured in the report (such as Brick and Mortar, Fast Fashion, Consumer-to-Consumer and Luxury), D2C is the strongest next to Luxury.
After sweating out the early months of COVID-19, several national gym chains are finally experiencing a healthy increase in membership levels. Our competitive analysis of gym companies illustrates that U.S. customer counts steadily increased throughout 2021, and memberships at gym chains such as Crunch Fitness, Planet Fitness, and Anytime Fitness almost reached or exceeded pre-pandemic levels. Consumer transaction data further shows that Planet Fitness (NYSE: PLNT) continues to experience a significant spike in new customers every January, corresponding with the popular New Year’s resolutions to get fit or live a healthier lifestyle.
As this second pandemic year wraps up, we dove into foot traffic for leading gyms to understand how the offline fitness sector performed in 2021 and where it’s headed in 2022. Gyms suffered a heavy blow over the pandemic. Safety concerns, lingering restrictions and even the challenge of exercising while abiding by indoor mask requirements kept many people away from gyms long after the initial closures. Meanwhile, a large number of fitness consumers claimed that they were not planning on ever renewing their membership after discovering the cost and convenience advantages of home exercise.
First Take-Two bought Zynga. Then, Microsoft acquired Activision Blizzard. Now, Sony is going after Bungie. The video game world seems to be consolidating more quickly than a Minecraft God Bridge. But will these acquisitions bring in the new customers and strengthen the loyalty that the new parents expect? In today’s Insight Flash, we answer these questions through our newly launched CE Transact Subscription Metrics dashboard and CE Receipt data, focusing on customer loyalty, new versus repeat user mix, and average price per item.
2021 was another momentous year for mobile app publishers and developers. Over a year after the first pandemic-induced growth, the app industry rocket ship was still on an upwards trajectory. But against that, there were new operational challenges to navigate. For example, Apple 'deprecated' its identifier (IDFA), which meant most advertisers were no longer able to track and measure their users' actions without an informed opt-in. However, despite IDFA hurdles, as App Annie's State of Mobile 2022 report makes clear, the collective numbers were all up.
With 2021 behind us, we dove into foot traffic trends at CVS, Walgreens, and Rite Aid to analyze how these pharmacy players performed and uncover changes to consumer behavior. A lot happened in the pharmacy sector over the past year. CVS and Walgreens announced some major strategic shifts, with CVS intending to downsize its store fleet while Walgreens will expand and diversify its physical footprint. And since the spring, the two category leaders have seen significant year-over-two-year (Yo2Y) visit increases, driven by the heightened demand for wellness products as well as the pharmacies’ ability to administer COVID vaccines and tests.
According to our latest retail report, Benchmarking the Global Mobile Retailing Landscape, fast fashion apps are only getting trendier. The report looks at the global and regional shopping app leaders across the whole year and zooms in on U.S. markets of Brick n' Mortar retailers, Fast Fashion, Direct to Consumer, C2C Marketplaces and Luxury retailers. Our Fast Fashion market includes the top 15 most-downloaded apps and posted 11.4% positive growth from 2020.
Notable Hit: (PENN:NASDAQ) On Thursday February 3, 2022 Penn National Gaming, Inc. (PENN) posted better-than-expected revenues of $1.57bn surpassing the consensus estimate of $1.49bn or by +5.4% and in the same direction as Advan's forecasted sales. The revenue was up 53% YoY - Advan's foot traffic data captured an increase in foot traffic of +43% YoY at its casinos for Q4 2021. The stock was up +11.5% the from previous close shortly after the opening bell. Advan's footfall data has a correlation of 0.99 on a YoY basis with PENN's top-line revenue over the last 12 quarters.
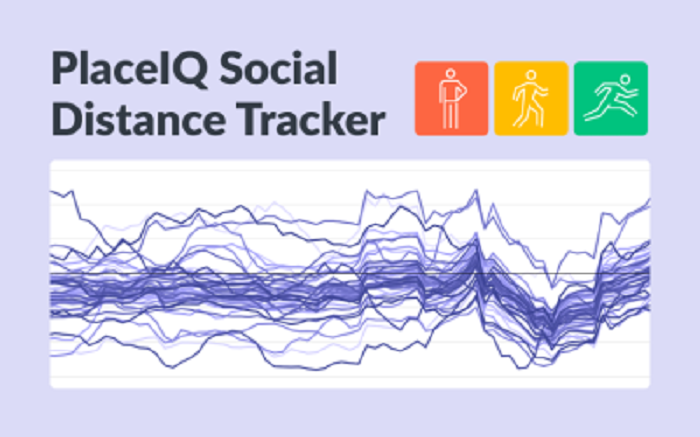
Where we sit – in New York and the San Francisco Bay Area – cases are coming down fast. Hope is on the horizon and it looks like the pattern we watched in South Africa and the UK will play out here: Omicron will spike COVID case counts like never before before leaving as fast as it arrived. Looking at these case patterns alongside our foot traffic data, the patterns look very, very similar to the lead up to 2021’s Second Reemergence: a period of sudden foot traffic gains shared by nearly all categories.
Last month, Netflix raised the price of its US subscription plans for the third time since 2019. Are the increased fees just keeping up with inflation, or will Netflix see a dip in subscribers in a saturated marketplace? In today’s Insight Flash, we provide a sneak preview of our soon-to-launch Subscription Spend dashboard to answer this question, including retention over time, cohort behavior surrounding the last price increase, and new customer metrics. Consumer Edge US Transact Subscribers can use these dashboards to continue to track these metrics in reaction to the most recent increase.
For most weeks of the second half of 2021, nationwide weekly retail foot traffic has been up or equivalent to 2019 levels. But as hybrid work and migration shifts keeps urban occupancy down and travel restrictions continue to limit tourism, some major cities are still feeling the pandemic’s impact. Clearly, some cities have been more affected than others. Of the four major cities analyzed, New York City – where the retail sector relies heavily on tourists and office workers – suffered the heaviest blow.
Pathmatics now offers granular data directly from viewers on Connected TV (CTV) devices that show who’s advertising on subscription over-the-top (OTT) video platforms including Hulu, Pluto TV, Tubi, Peacock, and Paramount+. For example, Pathmatics Explorer reveals that Procter & Gamble (P&G) was the No. 1 advertiser across our supported streaming platforms from January 1, 2022 through January 15, 2022, spending more than $9 million with its creatives garnering over 353 million impressions.
As the U.S. continues to adapt to the COVID-19 pandemic, there is more attention than ever on the health and wellness space, from COVID vaccines to rapid tests. This ever-changing medical landscape made it essential for advertisers to quickly adjust their spending and creative strategies to keep up with the latest trends. Pathmatics has recently released new, deeper categories in Explorer, allowing you to find insights into Health & Wellness advertising like never before.
Do you typically show up to a Super Bowl party ready for football, food or advertisements? If you’re like us, you pay more attention to the advertising strategies than what’s being dished out on the field. And it’s not just because the commercials are hilarious or captivating. The average NFL regular season game earned a mere 1% of what the 2021 Super Bowl raised. This is arguably the biggest media event of the year.