The NFL season is back this year with several changes. One of the most significant changes is the sports league’s stance on betting. Up until this year, the NFL has opposed legalized betting. But this year, the league announced that it signed deals with three Official Sports Betting Partners—Caesars Entertainment, DraftKings and FanDuel. With this change, we’ve seen programmatic advertising in this category increase 157% year-over-year, with DraftKings in the driving seat.
Warby Parker—a Digitally Native Vertical Brand (DNVB) specializing in eyewear—has visions of an IPO. Warby Parker is known for its at-home try-ons and its “buy a pair, give a pair” initiative. The DTC company started in ecommerce and later became omnichannel, with a network of stores throughout the U.S. Consumer transaction data shows how sales have grown at Warby Parker during the pandemic, as well as how the company stacks up against other eyewear competitors.
September 17, 2021
/
Business
Allbirds IPO
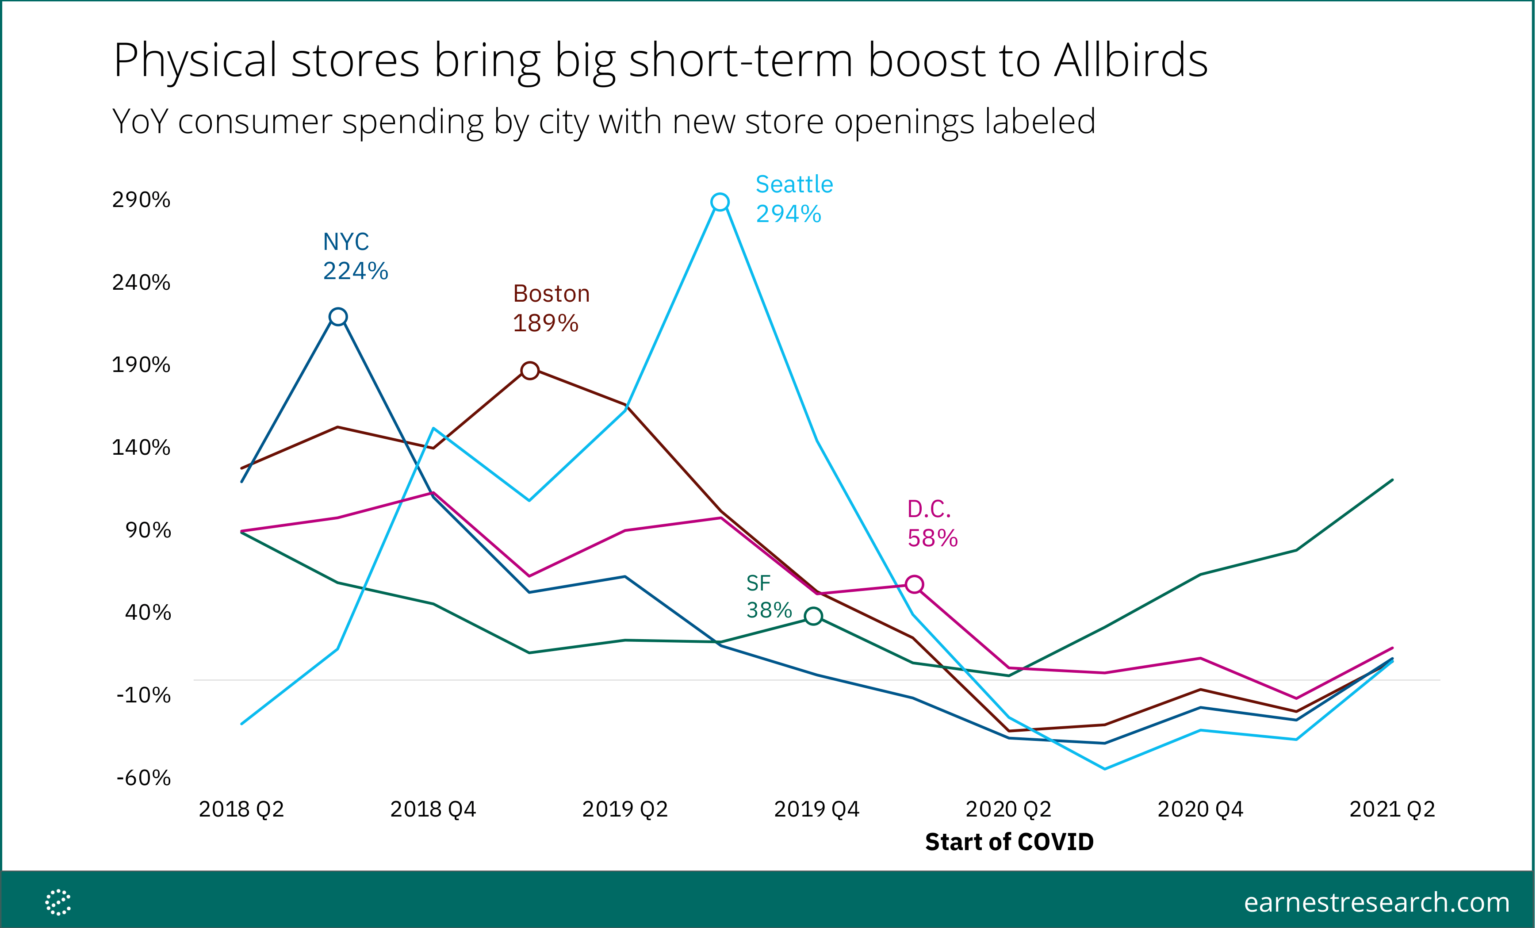
Sustainable footwear brand Allbirds has filed for an IPO to trade as $BIRD on the Nasdaq, joining a slew of other DTC brands going public. While Allbirds built its brand on direct e-commerce sales (almost 90% of Allbirds sales happen online), opening physical stores is increasingly important to the brand in attracting new customers, as cited in Allbirds’ S-1. Using Earnest consumer spend data, we analyzed the degree to which Allbirds sales were impacted by new store openings in cities across the U.S.
August saw a reversal in the upward momentum the restaurant industry’s sales and traffic had been riding in recent months. Amid a rising number of COVID cases and wide media coverage of its Delta variant, sales growth was 6.1% during the month, a drop of 2.1 percentage points compared to July’s strong sales growth. This was the softest sales growth reported for any month since May, and the worst traffic growth in the last three months. Traffic growth was -5.4% during August.
In May 2021, Shein made headlines by overtaking Amazon as the number one shopping app on iOS and Android. The June announcement that Shein may IPO at a $47 billion valuation rattled public attention again. How did this Chinese app seemingly emerge out of nowhere to become the most downloaded in the U.S.? In this article, we’ll use data from our eCommerce solutions Research Intelligence and Shopper Intelligence, to analyze Shein and see if it’s truly a threat to retailers like Amazon and Walmart. Hold your breath for the Shein vs. Amazon face-off.
When many Americans sheltered in their homes early in the coronavirus pandemic, meal delivery sales reached new heights. Our data reveals that in August 2021, sales for meal delivery services grew 15 percent year-over-year, collectively. The ongoing pandemic may also be driving more Americans to make their first meal delivery purchase. In August 2021, 50 percent of U.S. consumers had ever ordered from one of the services in our analysis, up from 43 percent a year ago.
At the onset of the pandemic, working from home became the new reality. At a time when more and more employers are reopening their offices and asking their employees to go back to in-person work, we are looking at how remote job postings evolved and how it transformed the labor markets. In early 2020, the share of remote job postings quickly increased during the initial lockdowns. More interestingly, however, the trend has since continued upwards —the share of job postings that mention “remote” has increased from 1-2% pre-pandemic to 8-9% today.
China is one of the biggest markets for luxury worldwide. The luxury market in China has seen a healthy growth versus the same period two years ago for the first half of 2021(+107%YoY2). This acceleration continued during the first three weeks into July, but surprisingly dropped to +46% YoY2 during the last week, as seen on the chart below. Most noteworthy is the stock price drop for major luxury brands by mid-August, roughly about 10%.
When we last looked into liquor store visits, foot traffic to the sector was significantly higher than it had been in 2019. A couple of months later, it looks like visits to alcohol retailers are still booming. Although the country is mostly reopened and the wider retail economy is on the rise, liquor store visits are still significantly higher than 2019 levels. Analyzing visits to three regional chains (BevMo! on the West Coast and Arizona, Spec’s in Texas, and ABC Fine Wine & Spirits in Florida) and to one national chain (Total Wine & More) reveals that retail alcohol sales are still surging.
Between Disney’s Magic Kingdom’s 50th anniversary celebration and Halloween, a season of fun activities at amusement parks was planned starting next month. Unfortunately, Delta is putting a damper on the Fall fun. Just as travel began to recover, families cancelled their plans again. How does that impact advertising trends? Disney fans were excited to return to the theme parks in California and Florida once they reopened and mask mandates were relaxed.
The rise of online grocery delivery—alongside record growth of the restaurant and convenience store delivery sectors—continues to be an area of interest for many businesses this year. Uber Eats recently announced a grocery delivery partnership with Albertsons while DoorDash also expanded in recent months, partnering with convenience stores and grocery retailers to provide delivery on top of their already existing DashPass service.
The Home & Garden Industry has been one of the fastest growing in both the UK and the US as more time at home has driven shoppers to make those spaces more comfortable. In today’s Insight Flash, see how UK and US growth compare overall as well as by channel, and which brands are growing the fastest in each geography. The Home & Garden industry has been one of the strongest in both the UK and the US in recent years, with positive consumer spend growth on a two-year basis on both sides of the Atlantic for most months since the beginning of 2019. With the exception of summer 2020, industry growth in the US has outpaced industry growth in the UK.
When we last looked at the Wholesale Club sector, the leading players were all showing strength ahead of the wider retail reopening. Yet, the strength in grocery alongside rising visits in restaurants created the potential for the sector’s top chains to see lower peaks in the summer. We dove into the data to see how the summer treated these brands. Earlier in the year, we noted that Costco visit data was indicating that while the brand was seeing lower overall visits, the actual number of unique visitors was rising.
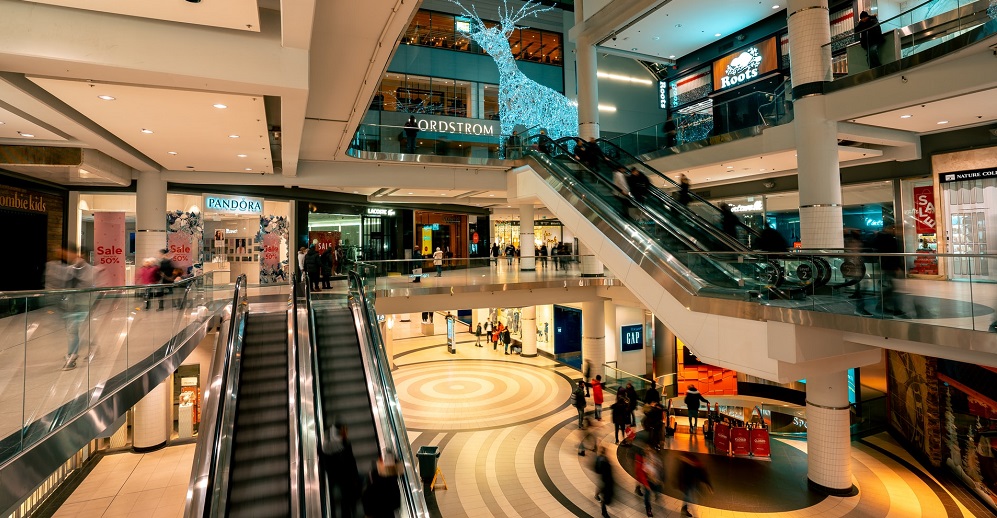
There was a location data report published last month called ‘Malls Rise Once Again’ that caught people’s attention. It claimed that malls have made a ‘full COVID recovery’ and have as many visitors as in 2019. We at Advan live and breathe location data, so our intuitive response was ‘no way, how have we missed this… ’. The reality is, while mall traffic has certainly been improving, it is still down 22% versus 2019. If the visitation estimates for such big, and therefore easier to measure, properties are so off from reality
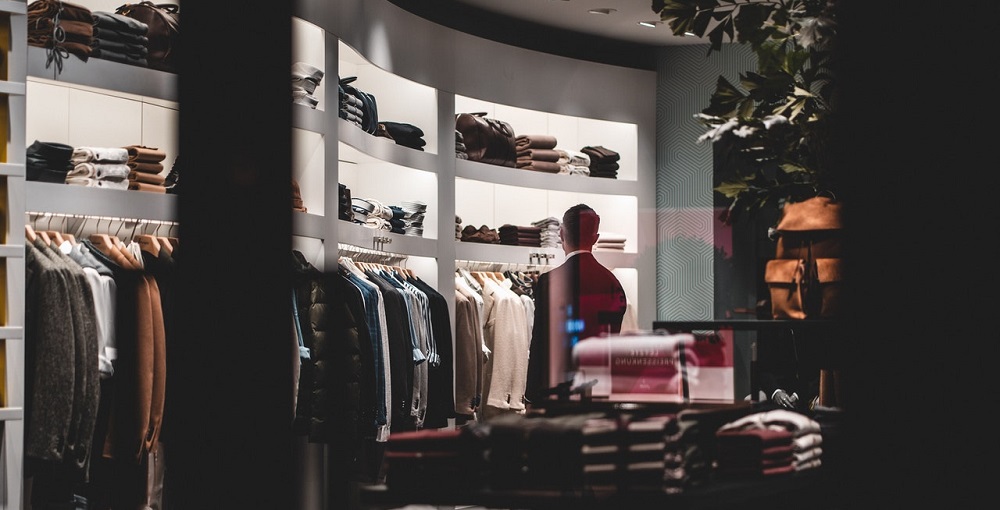
Company performance often differs across geographies. Often, more than one data source is needed to get a complete view. CE Transact provides this view in both the US and the UK. For a company like Abercrombie & Fitch, the data has been highly predictive in both markets. In today’s Insight Flash, we compare channel trends and brand growth across the two geographies. For the most part, online spend growth has surpassed offline spend growth for Abercrombie & Fitch in both the US and the UK since January 2020.
In our Quarterly Index, we noted that the pent-up consumer demand for home furnishings gave many home goods chains a visit boost in Q2 2021 – but some brands, like Bed Bath & Beyond and Tuesday Morning, were still struggling. With Q3 almost behind us, we dove into the foot traffic data to uncover the summer recovery trajectory of these two brands. While brands like Home Goods and At Home have succeeded in tapping into the emergence of home nesting – July visits were up 28.6% and 16.9%, respectively
In June 2021, global ecommerce company Etsy announced that it would acquire Depop, a UK-based resale marketplace that has also been gaining traction in the US. Consumer transaction data shows that during the pandemic, a growing percentage of U.S. customers at Depop have also been making purchases at Etsy. Additionally, cross-shoppers between the two companies are more likely to buy more frequently at each company compared to customers who only shop at one of the companies.
The Revolving Door, the movement of public sector employees to private sector companies, is a heavily scrutinized Washington D.C. phenomenon. The movement between regulators and the companies they regulate can be problematic: when lobbyists turn into regulators, and vice versa, the transparency and fairness of regulatory policy is potentially jeopardized. With our data spanning hundreds of millions of careers, we detect the inflows and outflows of regulators. The charts below show the most frequent transitions out of and into the largest regulatory bodies in the US.
“A lot has changed” we wrote in our 2019 global roundup of internet speeds based on the Speedtest Global Index™. Little did we know how much was about to change. But two things remain the same: the internet is getting faster and the Speedtest Global Index is still a fantastic resource for tracking improvements on a global and country level (if we do say so ourselves). Today we’re taking a look back at how much internet speeds have increased over the past four years and which countries have seen some of the largest gains.
Shopee, headquartered Singapore, has become the top shopping app in Latin America. Shopee originally launched in Southeast Asia but in October 2019, brought its mobile app to Brazil. Now the country is its largest market as judged by monthly active users, overtaking Indonesia. Latin America and Southeast Asia are both emerging growth markets and Shopee's app is the largest ecommerce app in both of them.