January has historically been the Black Friday of the fitness industry, with New Year’s Resolutions spurring an increase in gym memberships and athletic equipment purchases. COVID-19 has changed the dynamics dramatically for these subindustries, but can January resolutions at least provide a temporary adrenaline boost for Athletic Clubs? In January 2021, the number of individuals paying for Athletic Clubs showed a dramatic decline of -45% y/y.
Don’t let the box score fool you. Tom Brady may have won another ring, but Super Bowl LV was hardly a replay for the brands who did (and didn’t) invest in commercials and sponsorships for the big game. For the first time, Comscore (NASDAQ: SCOR), a trusted partner for planning, transacting and evaluating media across platforms, joined forces with Hive, a leading provider of enterprise AI solutions, to analyze marketing within and around TV advertising’s biggest day.
It is no surprise that consumers have quickly adopted app banking over the last 10 years, which is available 24 hours a day with no waits. However, the retail banking app is just one facet of a wider revolution in mobile finance. Investing, payments, loans – all are being upended by agile new digital replacements. In 2020 – powered by COVID-19 stay-at-home orders – consumers embraced these new alternatives in record numbers.
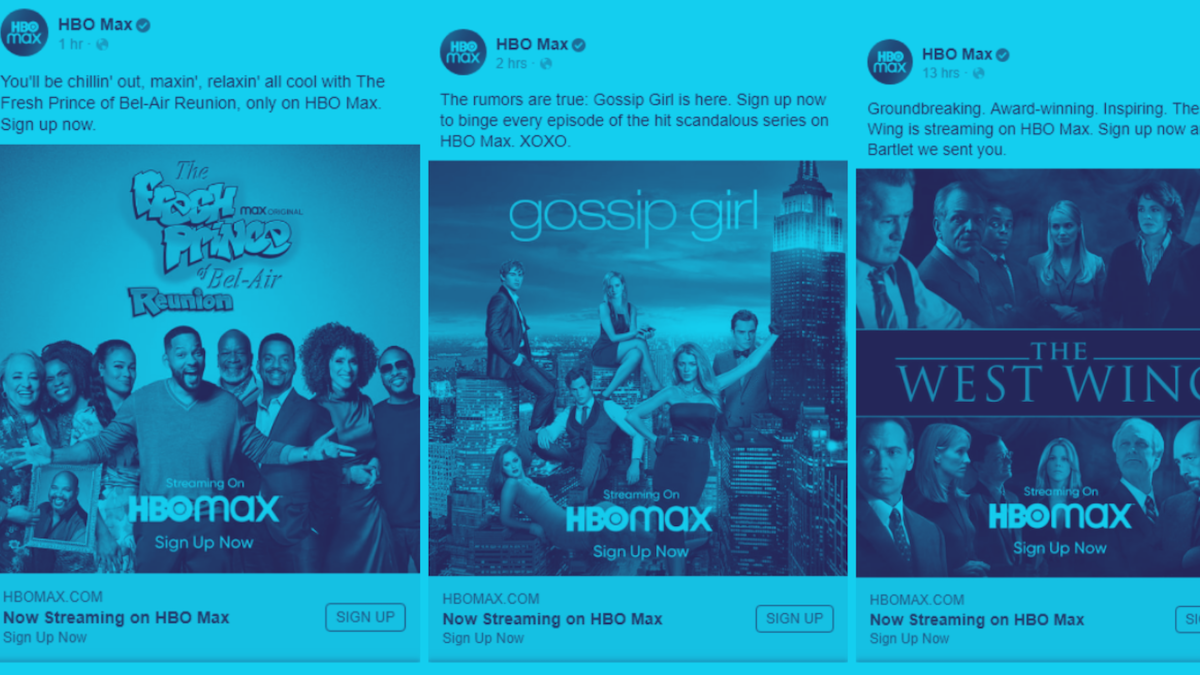
New streaming brands such as Peacock TV, Discovery Plus, Apple TV+, and Disney+ have hit the advertising circuit heavily since launching in 2020 — but none (including usual heavy hitters Netflix and Hulu) have spent more in 2021 than HBO Max. In fact, HBO invested 89% of its digital ad spend in January ($53M) in HBO Max ($47M). That’s nearly $20M more than the next highest ad spender of the month, LendingTree ($37M). It’s also more than what Amazon ($35M) spent on digital ads for its entire umbrella of subsidiaries, including Prime Video. And it’s even more than what Procter & Gamble spent last month ($32M) on its entire suite of CPG products.
Whether it’s a strained pandemic relationship coming to an end or individuals looking for companionship after a long year alone, dating app usage and spend have increased significantly in the past year. Consumers spent over $3 billion on dating apps in 2020, up 15% YoY globally, seeing a total of 560 million dating app downloads. Going into Valentine’s Day, we can expect this trend to continue with the most popular dating apps encouraging users to put themselves out there.
After the lockdown last spring that forced manufacturers from all sectors to halt production, auto makers now have to face another challenge: the global chip shortage due to the high demand on consumer electronics (laptops, gaming consoles, TVs etc.). The increased need for the technology devices along with the initial lockdowns and employee furloughs overwhelmed chipmakers and now are struggling to keep up with the surge in orders.
In this Placer Bytes, we dive into the office supplies sector and the data from Macy’s outdoor concept – Market by Macy’s. While not quite as catchy as the Chicken Wars the battle for supremacy in office supplies warrants notice, especially with Office Depot recently rejecting a Staples acquisition offer. Looking at both brands, there is a clear narrative guiding the conversation around the sector – how can it survive?
The Big Game that almost never was - one of the final remnants of 2020 before we can truly look ahead to the new year...or, at least for football fans. A season filled with covid19 restrictions and protocols, multiple team outbreaks, and canceled games, many prognosticators thought we'd never get to the Super Bowl - but here we are! And although we won't see all the ads until the big game, several brands have already released their spots. And, in true 2020 fashion, some brands are doing things a little different this year.
Consumer Edge data has been a strong predictor of H&M sales growth in both the US and the UK. But, the similarities between the markets may end there. In this week’s Insight Flash, we compare trends in both markets to assess differences in growth rates, which months are the most important to monitor trends, and brand performance. The US and the UK markets behave very differently, making it crucial to be able to track trends in both.
The US version of Discovery Plus officially launched one month ago. Since then, the mobile app has been downloaded about 3.3 million times total across iOS and Google Play. Discovery+ labels itself as “the only streaming service with the greatest real-life entertainment from your favorite TV brands— including HGTV, Food Network, TLC, ID, Animal Planet, Discovery Channel.”
In this Placer Bytes, we take a look at overall retail performance in 2020 and 2021 and dive into Southeastern’s Winn Dixie – even without their IPO. The wider retail sector had a memorable 2020 and while there were some categories that outperformed, it was certainly a challenging year for offline retail. While the wider retail segment saw visits up 3% and 4% respectively in January and February, the havoc of the pandemic made its presence felt in the spring.
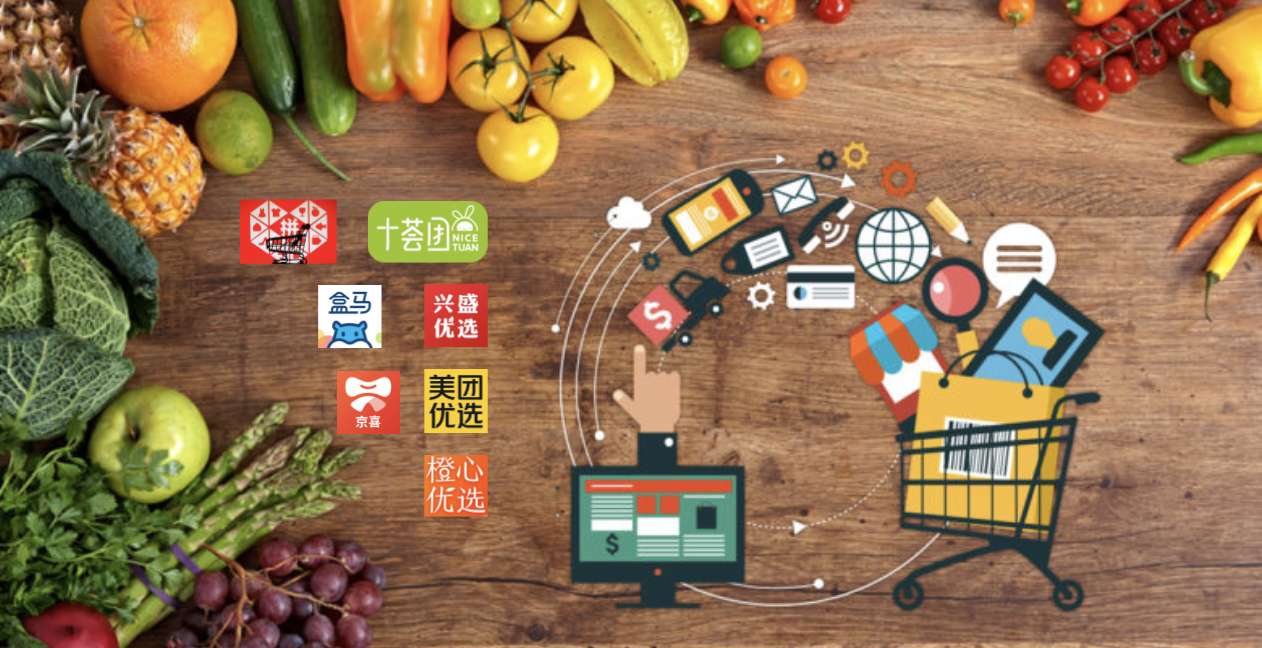
Community group buying, an e-commerce model of group purchases by residents within the same neighborhood, is becoming increasingly popular since the second half of 2020. This industry sprang out in 2018, but got suppressed in 2019 due to poor regulations. However, after its re-entry into 2020 and the impact of COVID, on-demand grocery markets became the hottest topic again.
In this Placer Bytes we dove into the Q4 data surrounding the Yum! Brands’s portfolio, Chipotle and how 2021 has kicked off for these QSR leaders. Back when we checked in on Yum! Brands’s most popular chains, Taco Bell, KFC and Pizza Hut, monthly visits were still significantly down for all three brands, with Taco Bell showing the most severe year-over-year declines in traffic.
New research from Comscore (Nasdaq: SCOR), a trusted partner for planning, transacting and evaluating media across platforms, found digital payments usage in the United States increased as consumers turned to online food delivery services amid the COVID-19 pandemic.
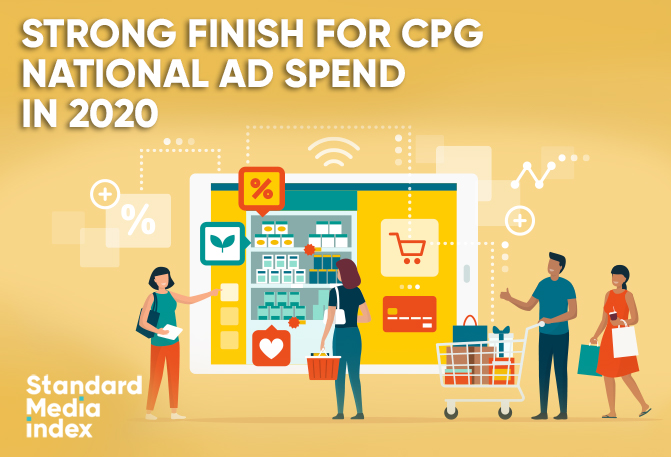
After a dismal second quarter 2020, the national ad marketplace ended with a strong fourth quarter. SMI reported no category was stronger in the final quarter than Consumer Packaged Goods, with year-over-year ad spend growth of +34%, the most of any vertical. For calendar year 2020, CPG ad spend grew +10%, compared to -7% for the entire ad market.
To be clear, the stock price surges for GameStop and AMC had little, if not nothing, to do with their offline traffic, online traffic, or any other normal metric. However, they do provide a good opportunity to take a deeper look at two brands in flux.
Britain’s battered pub and restaurant sector is staring at its worst period of the pandemic as footfall flatlines for more than a month. The Huq Index for Restaurants & Pubs fell sharply post December 10th, and has stood at 5pts since January 9th – down 4.6pts in the last 30 days and little discernible movement in the last seven. Of the three constituent sectors, Pubs, Restaurants and QSR, Pubs have been the worst affected – reading less than 1pt over the equivalent period.
With brick-and-mortar retail suffering due to COVID-19, several specialty players have sought haven within higher-traffic big box retailers. This is a familiar model in the beauty industry, where specialty players have long operated their own counters in department stores. This makes it unsurprising that two of the most notable tie-ups in recent months have also been in the beauty space – Target’s announced partnership with Ulta (which was reviewed in a prior Insight Flash), and now Sephora’s entry into 200 Kohl’s locations.
It was the best of times, it was the worst of times . . . actually, the COVID-19 pandemic has just been the worst of times. But it has led to interesting divergences in the US and UK grocery markets. In today’s Insight Flash, we compare the two, digging deep into relative performance and market share for Instacart in the US and Ocado in the UK, in our first-ever flash leveraging our brand-new UK dataset.
In a year dominated by headlines around the struggles of apparel, the wider athletic apparel and athleisure space outperformed. When analyzing Under Armour, Nike and Lululemon we see all three brands enjoying year-over-year growth in January and February before the pandemic brought visits to a screeching halt. The three also recovered exceptionally well with visits down just 2.1% and 9.7% year over year for Nike and Lululemon respectively in October, while Under Armour saw 8.4% year-over-year growth that same month.