The number of unique, active buyers in a market is a key signal for liquidity and one of six measures that Real Capital Analytics uses to calculate the RCA Capital Liquidity Scores. In the chart below we show 18 leading commercial real estate markets and the buyer count measure for Q4 2020 compared to the average and range of the past 10 years.
In December 2020, 5.8% of home mortgages were in some stage of delinquency (30 days or more past due, including those in foreclosure), a small decrease from November 2020, but a 2.1-percentage point increase from December 2019, according to the latest CoreLogic Loan Performance Insights Report. The share of mortgages that were 30 to 59 days past due – considered early-stage delinquencies – was 1.4% in December 2020, down sharply from a post-pandemic high of 4.2% in April 2020 and below the year ago rate of 1.8%. The share of mortgages 60 to 89 days past due was 0.5% in December 2020, down from 0.6% in December 2019 and down from 2.8% in May 2020.
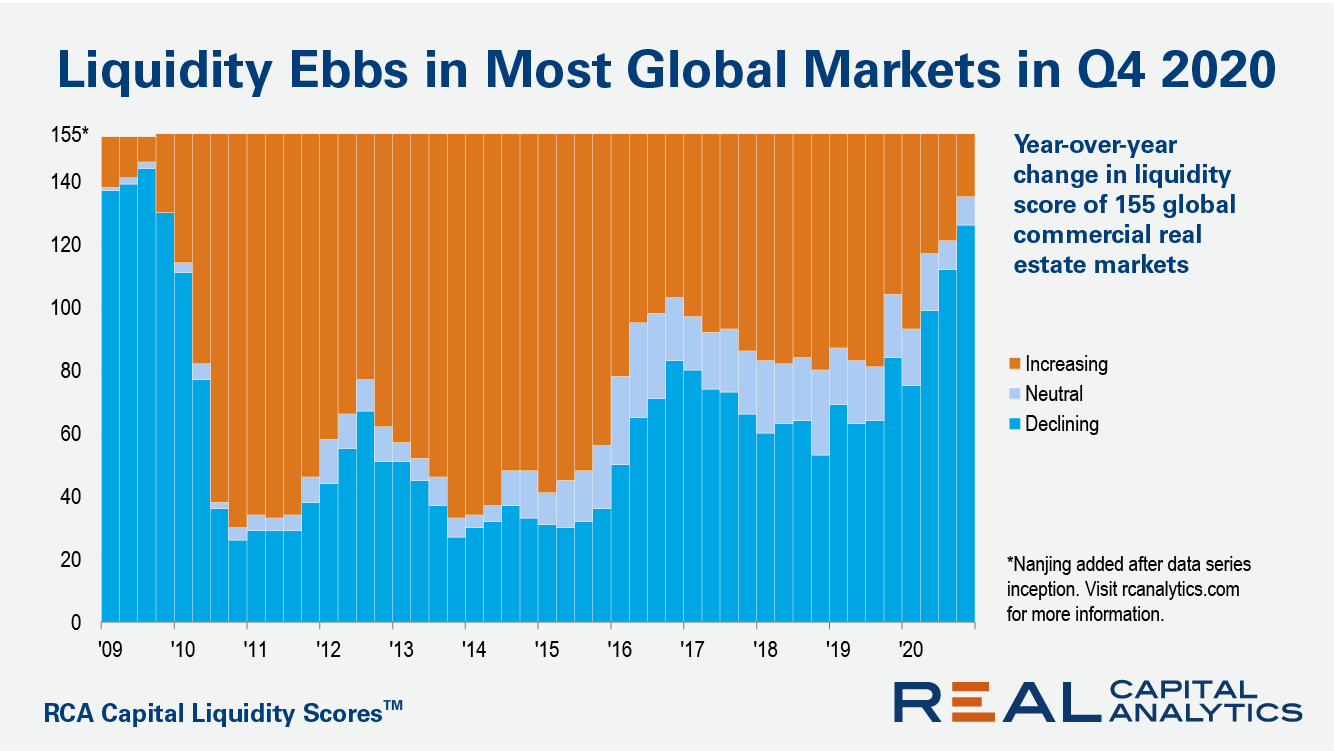
Commercial property market liquidity at the end of 2020 was below the levels from a year prior in 126 out of 155 markets worldwide, the latest update of the RCA Capital Liquidity Scores shows. The count of markets with scores falling on an annual basis was the highest since the end of 2009, during the Global Financial Crisis. However, there are signs of optimism.
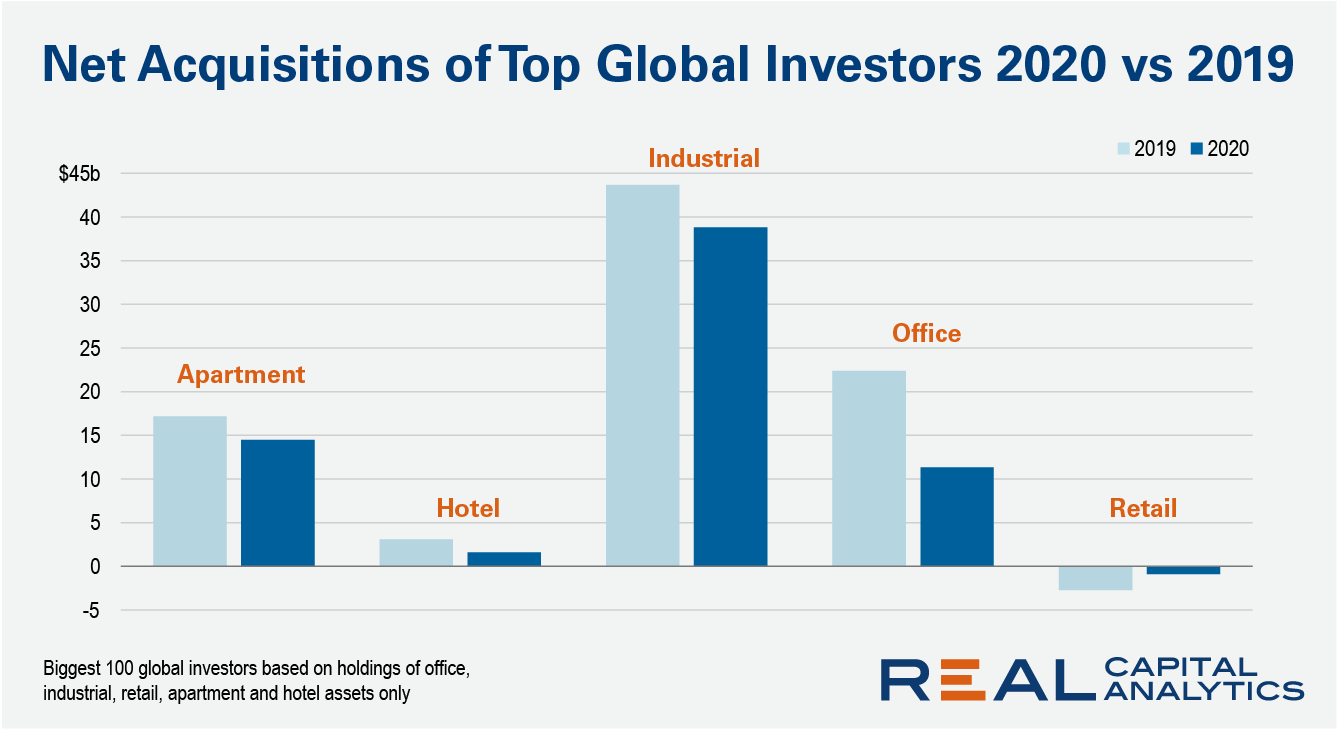
The top global investors acquired more commercial real estate in 2020 despite the challenges of the pandemic. There are clear signals in what they bought, however, that these investors are reacting to the uncertainty presented by the Covid-19 turmoil. Net purchases by property sector indicate that concerns about the office sector surfaced in 2020.
National home prices increased 10% year over year in January 2021, according to the latest CoreLogic Home Price Index (HPI®) Report. The January 2021 HPI gain was up from the January 2020 gain of 4.1% and was the highest year-over-year gain since November 2013. Low mortgage rates and low for-sale inventory drove the increase in home prices, however affordability constraints may work to slow home price growth later this year.
One of the major determining factors for multifamily performance is population and household change. 2020 appears to have brought about some dramatic shifts in population movement according to some early analyses such as one using LinkedIn data. Whether it was apartment demand results in suburban areas versus urban core, or the difference in demand between certain markets, signs of these shifts appear in the multifamily data.
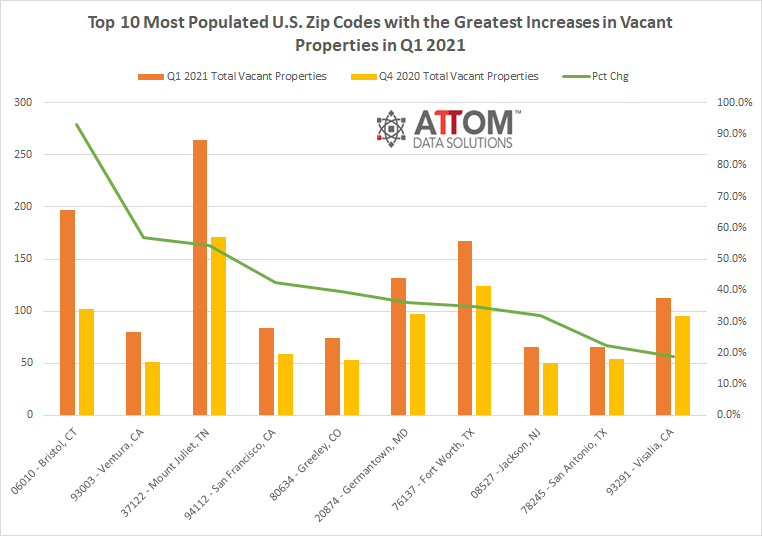
According to ATTOM Data Solutions’ new Q1 2021 Vacant Property and Zombie Foreclosure Report, there are just over 1.4 million U.S. residential properties sitting vacant in Q1 2021, representing only 1.5 percent of all homes. The report noted the number of pre-foreclosure homes sitting empty or “zombie foreclosures” is just 6,677. That figure is down 12.3 percent from 7,612 in Q4 2020 and 23.1 percent from 8,678 in Q1 2020.
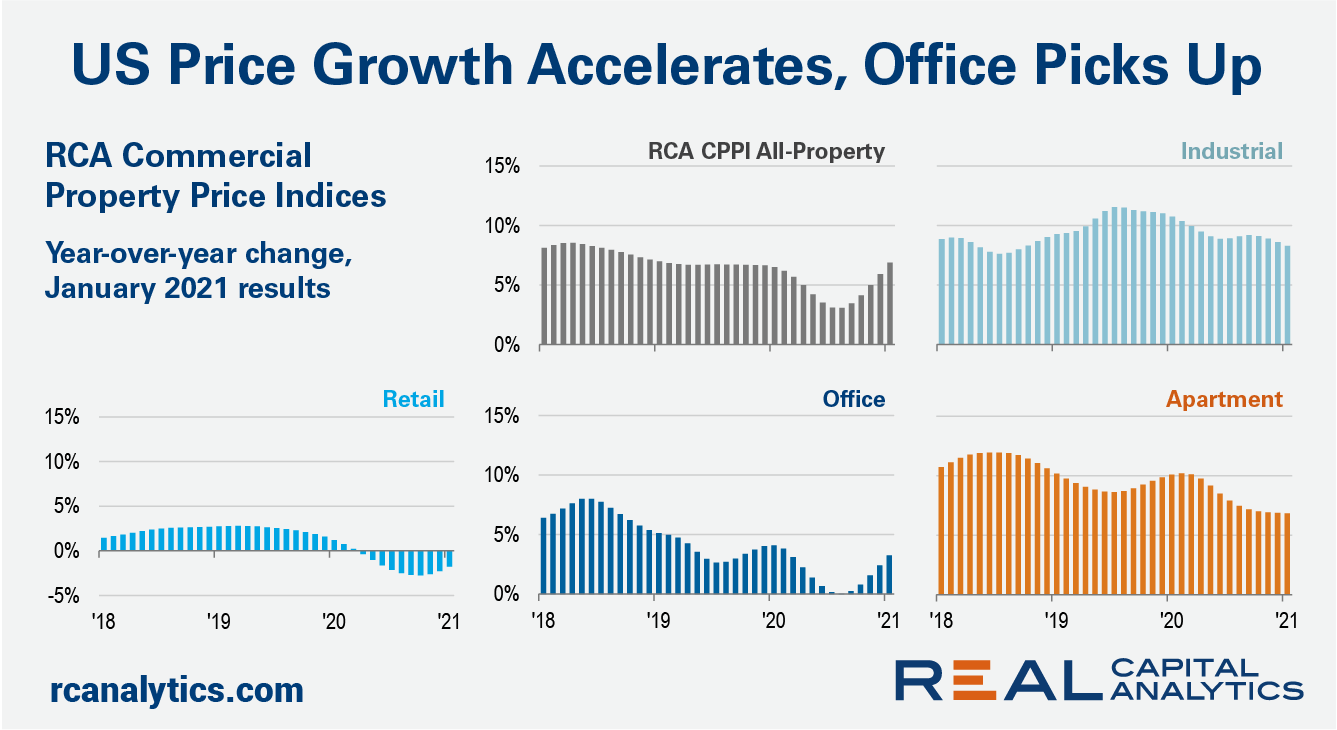
The pace of U.S. commercial property price growth accelerated in January, climbing back near the growth rates seen before Covid-19 struck, the latest RCA CPPI: US summary report shows. The US National All-Property Index rose 6.9% from a year ago and 1.2% from December.
This month’s data represents the clearest indication yet that rent prices are rebounding in markets across the country. Our national index increased by 0.7 percent over the past month, the largest monthly increase since the summer of 2019. The data continue to exhibit significant regional variation, but the days of plummeting rents in pricey coastal markets appear to be coming to an end, with cities such as San Francisco and Seattle experiencing positive month-over-month growth for the first time since the start of the pandemic.
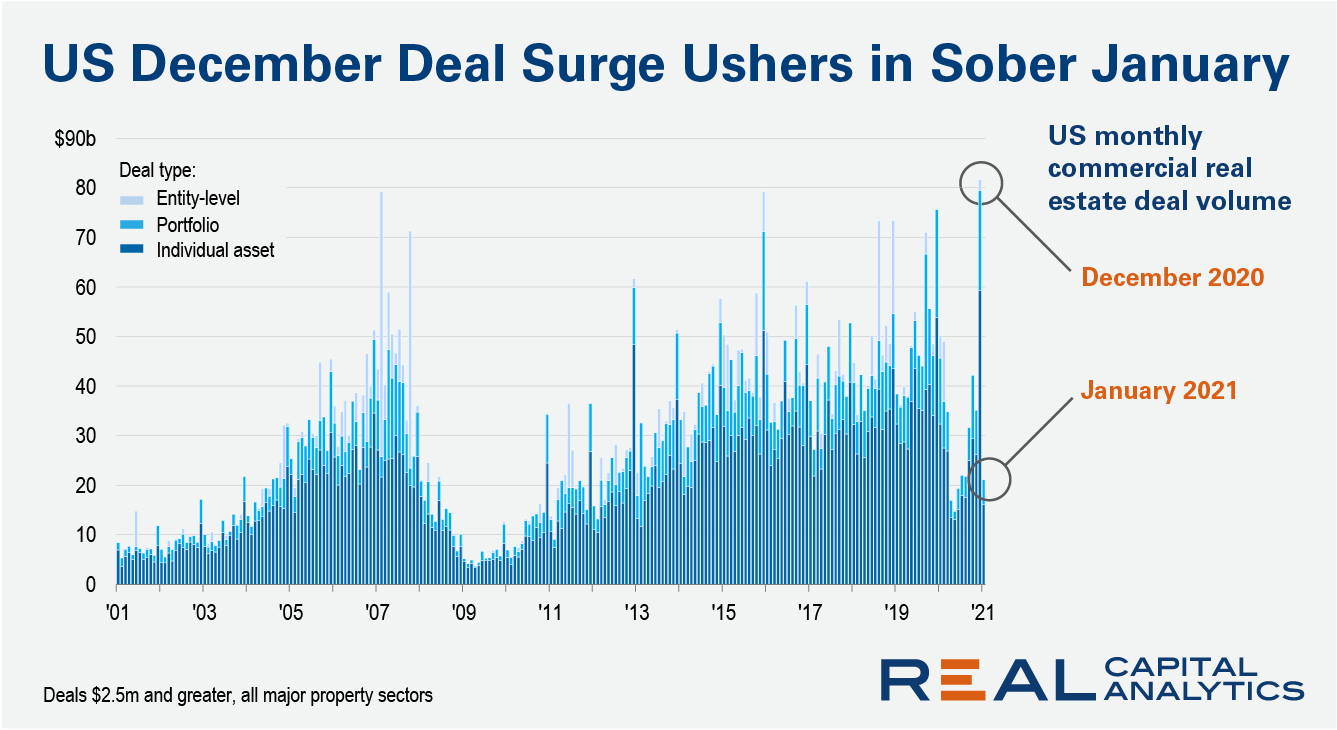
Activity in the U.S. commercial real estate market stumbled in January after an end-of-year surge in apartment, industrial and office sales had led December 2020 deal volume to a record level, the latest edition of US Capital Trends shows. Transaction volume fell 58% in January from a year prior, similar to the declines seen in the second and third quarters of 2020. By contrast, December deal volume had increased 8% year-over-year to broach the $80 billion level for the first time, according to RCA records.
Home prices in the U.S. have been rising consistently for nearly 10 years, and the pace of home price growth quickened in 2020, leading to record levels of home equity. The latest CoreLogic Home Equity Report found that the average amount of equity per borrower was nearly $200,000 at the end of Q3 2020, a gain of $17,000 from a year earlier and over $100,000 from 10 years earlier.
In this report, ATTOM looked at 3,588 zones around the United States with sufficient sales data to analyze, meaning they had at least five home sales in the fourth quarter of 2020. The report found that median home prices increased from the fourth quarter of 2019 to the fourth quarter of 2020 in 77 percent of Opportunity Zones with sufficient data and rose by more than 10 percent in nearly two-thirds of them. Those percentages were roughly the same as in areas of the U.S. outside of Opportunity Zones.
Interest in mortgages skyrocketed in 2020 – a year defined by lockdowns and stay-at-home orders. Record-low interest rates in the U.S. and the real estate impact also likely helped boost demand. The result: Traffic to mortgage lender websites shot up by 71% from 2019 to 2020. The extraordinary rise in mortgage industry-related traffic outpaced the greater financial services industry, which climbed just 25% over the same time frame.
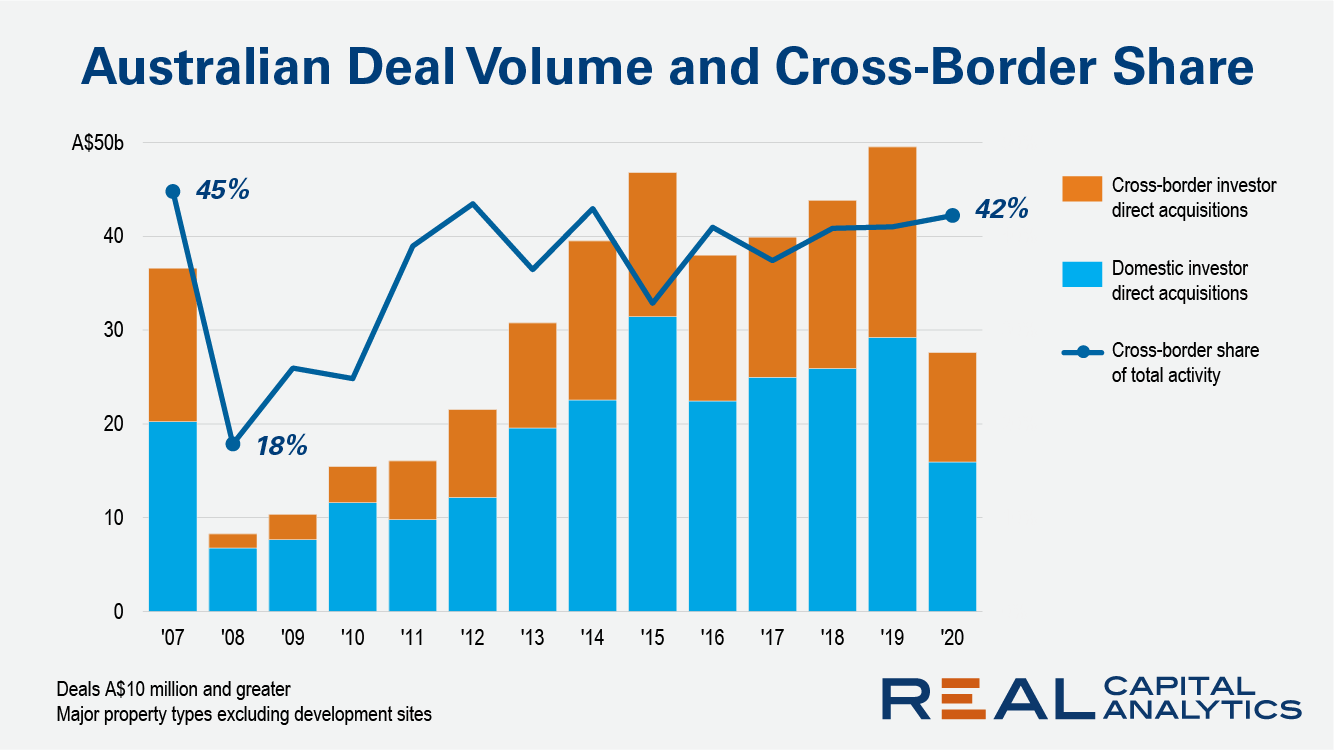
Cross-border flows into Australian commercial real estate sank in 2020, but the magnitude of the drop was moderated by a European champion: German institutional investment. Spending by groups headquartered in Germany alleviated fears that overseas investors would desert Australia, as occurred in the last global downturn. During the Global Financial Crisis (GFC), investors across the world retreated to the sanctuary of their home territories.
U.S. single-family rent growth strengthened in December 2020, increasing 3.8% year over year, showing solid improvement from the low of 1.4% reported for June 2020, and up from the 2.9% rate recorded for December 2019, according to the CoreLogic Single-Family Rent Index (SFRI). The index measures rent changes among single-family rental homes, including condominiums, using a repeat-rent analysis to measure the same rental properties over time.
As the pandemic wears on, the nation’s unemployment rate remains at elevated levels. With unemployment rate at 6.7% at the end of 2020, millions of people have likely been out of work for as long as nine months since April. And without a regular income, many homeowners who sought payment forbearance assistance under the CARES Act are likely to find themselves in an extended stay in forbearance.
First-time home buyers have been a growing share of the home buying population, a trend that accelerated in 2020. According to CoreLogic Fraud Consortium Loan Application data, the share of first-time buyers surged to 39% in 2020, up from 30% in 2016. While it may seem that first-time homebuyers have been highly encouraged by the onset of the pandemic and ensuing drop in mortgage interest rates, , our previous analysis suggests that the wave of first-time buyers was imminent irrespective of the pandemic as the largest cohort of millennials were settling down and approaching the median first-time home buying age of 32.
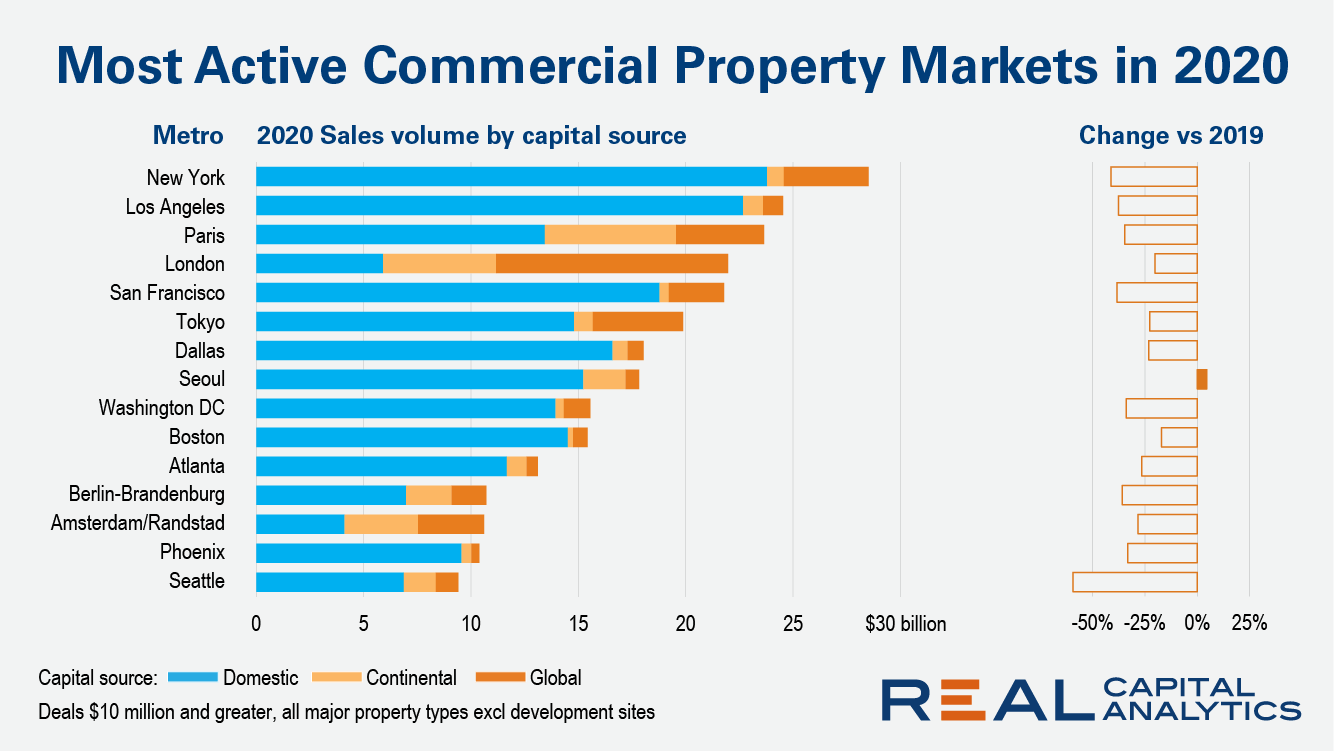
Just one of the top 15 most active global commercial real estate markets recorded an increase in sales volume in 2020 versus 2019. For the rest, the picture was one of falling transaction activity as the Covid-19 pandemic hampered dealmaking and soured the outlook for some commercial property types. In Seoul, volume crept up to an all-time high as domestic investors refocused on their home market. The Korean capital became the world’s largest retail transaction market in 2020 and second largest office market, behind Paris.
The share of mortgages that were 30 to 59 days past due – considered early-stage delinquencies – was 1.4% in November 2020, down sharply from a post-pandemic high of 4.2% in April 2020 and below the year ago rate of 2%. The share of mortgages 60 to 89 days past due was 0.6% in November 2020, unchanged from 0.6% in November 2019 and down from 2.8% in May 2020. The drop in early and mid-stage delinquencies from the spring indicates a lower share of mortgages entering delinquency after the initial surge after the start of the pandemic in the U.S.
Millennials are officially the nation’s largest generation, and spanning the ages of 24 to 39, they are now in their prime home-buying years. But for as long as they have been old enough to buy homes, millennials have lagged previous generations in fulfilling that goal. In this study, we combine data from the Census Bureau’s Current Population Survey and our annual Apartment List Renter Survey to assess whether millennials are catching up, or if they are truly less likely to attain homeownership than prior generations.


