Following the normal pre-4th of July slump, U.S. industry occupancy rebounded to 67.2% for the week ending 10 July 2021. While this was good news, the gain was much less than expected as weekly demand improved 3% to 26 million. In the same week of 2019, demand increased 13% week over week, and occupancy hit 74%. We believe this illustrates the continued shortfall in business and group demand that in normal times would have supplemented seasonal leisure demand.
A joint analysis of the latest air ticketing data by data firm ForwardKeys and Emprotur, Empresa Potiguar de Promotion Turística, shine some positive light on domestic tourism in Brazil, particularly to the star of Rio Grande do Norte, Natal, as the city demonstrates resilience and demand. The overall performance of the Brazilian domestic market in June reached 108% of the 2019 demand, encouraging considering the current climate.
Mexico is primed to be a top holiday destination from July to September, according to the latest air ticketing analysis by travel analytics firm, ForwardKeys. But the big news is that it is managing to welcome more international visitors beyond the USA – Ecuadorean and European travellers play a vital role in its reactivation this summer. Tourism is an important economic sector in Mexico, and the country plays a prominent role in tourism globally. In 2020, Mexico welcomed 23.3 million international tourists, around half of the inbound tourism volume recorded a year earlier.
Prior to the pandemic, holiday weeks tended to be lackluster due to the lack of business and group travel. During the pandemic era, that trend seems to be returning. Week over week, demand fell 1.7 million room nights, but the decline was less than what was seen in the comparable week of 2019 when demand fell 3.7 million room nights. There is limited business and group demand now, so the leisure surge mitigated the loss as more rooms were sold this week (25.1 million) than in the comparable 2019 week (24.8 million).
Australia has been one of the highest performing hotel occupancy markets with improving midweek demand alongside continued strength across weekends. Amid recent COVID-19 outbreaks and lockdowns, however, key markets in the country are showing noticeably lower levels of occupancy on the books for the coming weeks. When comparing the Forward STAR data updates of 28 June 2021 vs. 21 June 2021, Sydney’s average decline in occupancy on the books for the coming weeks and months was 13.8%.
In 2019, the tourism industry accounted for over 12% of Spain’s gross domestic product (GDP). Last year, it accounted for just 5.5%, many are wondering how it is positioned this summer. The team of analysts at ForwardKeys examined the latest air ticketing data to Spain this summer for international and domestic travel to uncover a few gems. While the international market is recuperating and growing to 50% of traveller volumes of 2019 July figures, it’s domestic travel pulling up the tourism sector during the pandemic
It won’t come as a surprise to know that On-Time Performance (OTP) has improved with the reduction in flights, particularly at the scale of reduction that the aviation industry is currently experiencing. Taxiways are not congested, airports are not operating at capacity, and airspace is currently unconstrained – essentially many markets still remain closed to each other, and people are not yet free to travel without a complicated set of quarantine and testing requirements.
The headline data looks encouraging, another 3.1 million more seats operating than last week, 4.1% growth week-on-week and global capacity now at 78.6 million. For context that is “only” 40 million fewer than the same week in 2019 although some 29 million ahead of the same week last year so that is positive. In line with continued lockdowns and confusion over travel requirements, a further 8 million seats have been removed by airlines for sale during the rest of July and a further 6.7 million for August. The chances of saving the summer for the airline industry have all but disappeared.
While summer travel has not yet been “record-breaking” as some predicted, growth for the U.S. hotel industry has simply been spectacular over the past month. We expect that June will produce more than 110 million room nights sold, the most since October 2019. Room revenues have also been a pleasant surprise and are predicted to be down just 10% from what they were in June 2019. Last week’s results added to the good news with most metrics reaching pandemic-era highs. Occupancy for the week ending 26 June 2021 hit 69.9%, which was the industry’s highest level in 88 weeks.
With this summer promising to be a Super Shot for Amusement Parks after their recent Free Fall, we take a Flying Swing at what May trends indicate for the Fun House to come. In today’s Insight Flash, we look at recent trends in the overall industry, the mix for each park of in-state vs. out-of-state visitors, and whether this summer’s attendance will be driven by loyalists or new visitors. In May 2021, Amusement Parks overall saw a decline of over -30% in the number of individuals making a purchase versus 2019.
After being grounded for over a year, Americans have begun traveling again. Now, people all over the country are trading the comforts of home with the experiences of hotels, resorts, and casinos. Our research suggests that both these industries have begun to rebound nicely from the pandemic. As of June 2021, foot traffic in hotels and resorts was up 140% over June 2020. Casinos are up 243% since June 2020. Although both sectors have seen great improvements since the peak of the pandemic, however hotels and resorts remain 30% below June 2019 levels, while casinos are still down 23%.
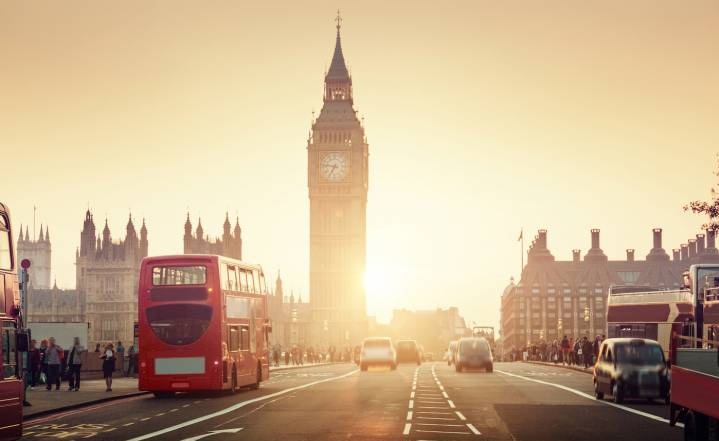
Beating the Monday blues is set to get easier in the post-pandemic world, as Huq’s latest insight into commuter patterns reveals a significant shift away from travel at the start of the week. Last week we looked at peak travel times on TFL’s Greater London network and how tends towards the evenings – with little apparent morning rush hour. Today Huq’s high-frequency mobility data shows how ‘hybrid’ working could impact businesses trading off the commute economy throughout the week.
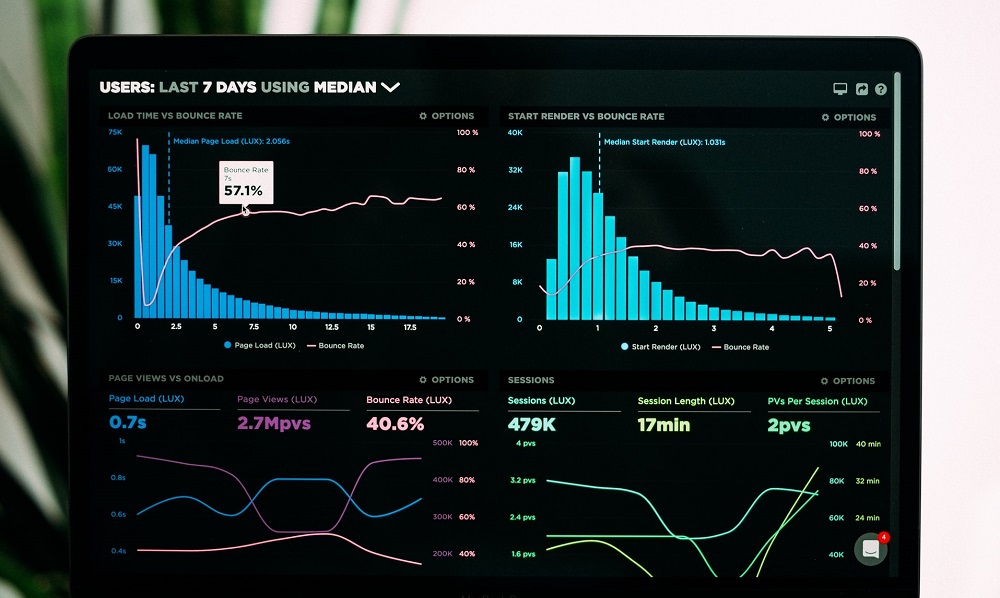
Following the roll-out of the vaccine against the COVID-19 virus, the initial excitement of post-COVID life appears to be wearing off – slightly. What does that mean for the market? In this month’s Digital Heat we see travel trends start to stabilize following the strong growth in previous months. Read on for a deeper dive into what’s driving these trends as well as other changes in online behavior. How are we doing this? Digital Heat, an easy-to-use heatmap to help you quickly identify at scale which industries and companies are most impacted by the current economic environment.
To work from home, from the office or both. The jury is still out. Large cities like London depend so much on the commuter market. How soon historic commuter patterns return – if at all – is very significant for the local economy. Earlier this week we looked at the rise in daily trips into the Square Mile from towns in Essex. Some tantalising indications emerged. Today we look at peak travel times on TFL’s Greater London network and measure how the profile has changed.
The last four weeks (ending Saturday, 12 June) continued to show a solid return to normalcy as we compare 2021 state-level weekly room demand against the comparable levels from 2019. As a reminder, STR currently benchmarks recent performance against 2019 performance levels rather than a pandemic impacted 2020. Twenty-six (26) states showed demand totals within a 10% margin of the corresponding period of 2019. Collectively, eight of those states actually sold more rooms for the 4-week period than they did 2019.
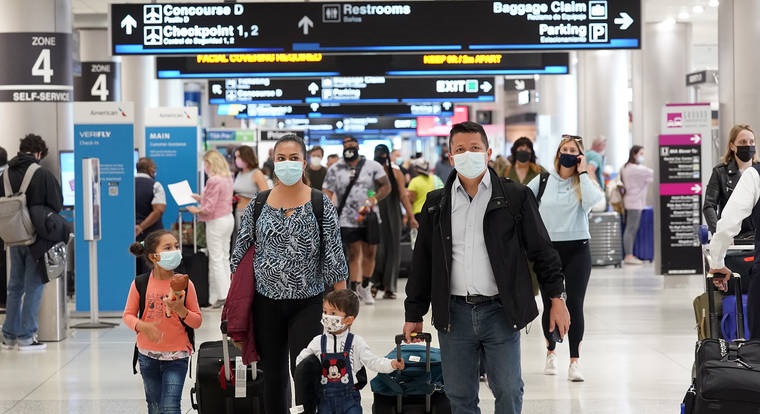
More than any other industry, travel feels like a large pendulum pulled to one extreme that is now quickly returning the other way. Perhaps _too_ quickly. Airline employees and Transportation Security Administration (TSA) agents are tasked with managing heavily booked flights, crowded airports, and passengers who’ve forgotten how to behave while traveling. Passengers are experiencing extremely long check-in and security lines, terminals with closed shops and restaurants, and multiple flight cancellations.
U.S. hotel industry occupancy soared to its highest level since November 2019, reaching 66.0% for the week ending 12 June 2021. Room demand surpassed 25 million in the week, up 1.6 million week on week, and was 91% of the level recorded in the comparable week from 2019. This is significant given the fact that business travel and group demand remain curtailed. Occupancy on Saturday reached 81%, a level like the Saturday of this year’s Memorial Day weekend, while the full weekend came in at 78.8%, the highest since fall 2019 and higher than the comparable weekend of 2019.
Knowing you might not have time to watch our full webinars, we are pleased to continue our series of COVID-19 webinar summaries. In this latest edition, we talk performance and signs of in Europe. While Europe prepares for the summer months, hotel performance levels remain low. The U.K. is the outlier most recently, however, with a 59.5% occupancy level on a rolling 7-day average ending with 6 June. That performance came as pent-up demand during reopening met additional demand for the half-term school holiday.
While occupancy across Brazil is taking time to recover, resorts have seen considerable upward movement with leisure demand growing robustly in the country and travelers seeking not just a getaway, but a full-blown experience. Before jumping into the metrics for resorts, let’s note a few occupancy milestones for context. Brazil reported its lowest pandemic occupancy level in April 2020 at 10.7% . Ten months later during January 2021, Brazil saw its highest pandemic occupancy level at 36.0%, driven by domestic demand at beach destinations around the New Year’s holiday.
The 2021 summer travel season has officially begun, and roughly half the US adult population is inoculated against the coronavirus. Is travel poised to recover from its near-death experience last year? We take a look at travel performance to date below. (See our prior analyses in this vaccinated-recovery series, including our general overview, our focus on dining, and on gyms).


