With reports of slowing online sales this Black Friday as shoppers rushed back to the crush of in-store shopping, many may be wondering how the king of online retailers, Amazon.com, fared. One key advantage of our CE Receipt data is that it captures the date that shoppers made an online purchase, while sources like transaction data often reflect when a credit or debit card is charged, usually not until an item ships.
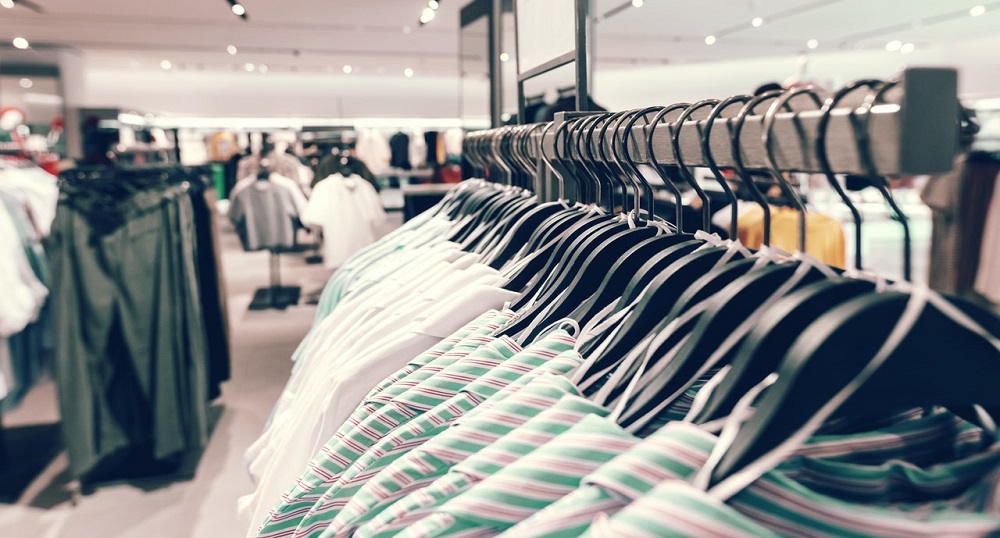
Traffic on Black Friday after Thanksgiving was materially higher across Advan Indices compared with last year’s levels. But visits are still down compared to 2019 records for most of the indices. Clothing and Accessories index saw an increase of 55% yoy but down 15.3% Yo2Y while Furniture and Food Stores including food stores such as Kirkland’s/Restoration Hardware and Kroger’s and Whole Foods respectively have bounced back to pre-pandemic levels.
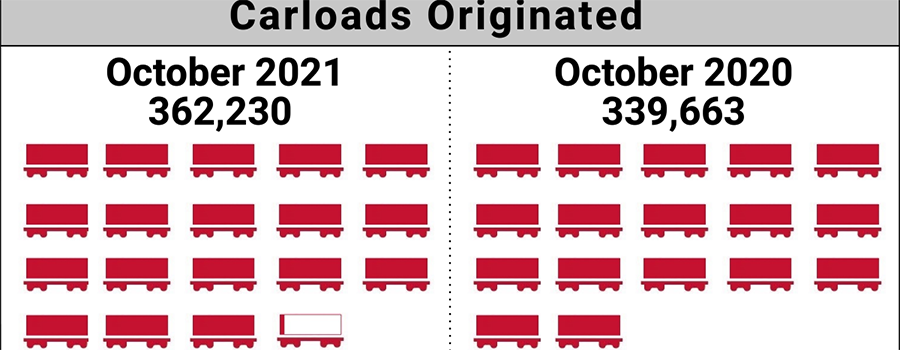
The number of carloads moved on short line and regional railroad in October 2021 was up compared to October 2020. Carloads originated increased 6.6 percent, from 339,663 in October 2020 to 362,230 in October 2021. Nonmetallic Minerals led gains again with a 63.4 percent increase. Crushed Stone, Sand and Gravel was up 22.1 percent, and Waste and Scrap Materials and Trailer or Container increased 20.0 and 16.8 percent, respectively. Motor Vehicles and Equipment led declines again, down 19.1 percent. Grain, Petroleum Products and Coal were also down in October.
As we approach the end of the year, we’ll be covering trends from 22 key markets. We’ll recap what each industry has experienced over the past year and what to watch for in 2022. Learn who are the top advertisers from each category and how they spend across formats. Of all things missed during the pandemic, travel was at the top of the list for many people. “\[Travel\] is a necessity, for lives and livelihoods, for families, as well as for economic and mental health,” said Gavin Tollman, CEO of the global guided tour company Trafalgar.
December 2, 2021
/
Business
Beauty Recap
Offline beauty visits came roaring back as restrictions on brick and mortar retail began to lift in spring 2021. Since then, foot traffic has remained impressively strong. As the sector heads into a critical holiday season, we dove into the data for Ulta, Sephora, and Sally Beauty to find out how the leading beauty retailers are performing in their owned stores and in their new collaborations with Target and Kohl’s.
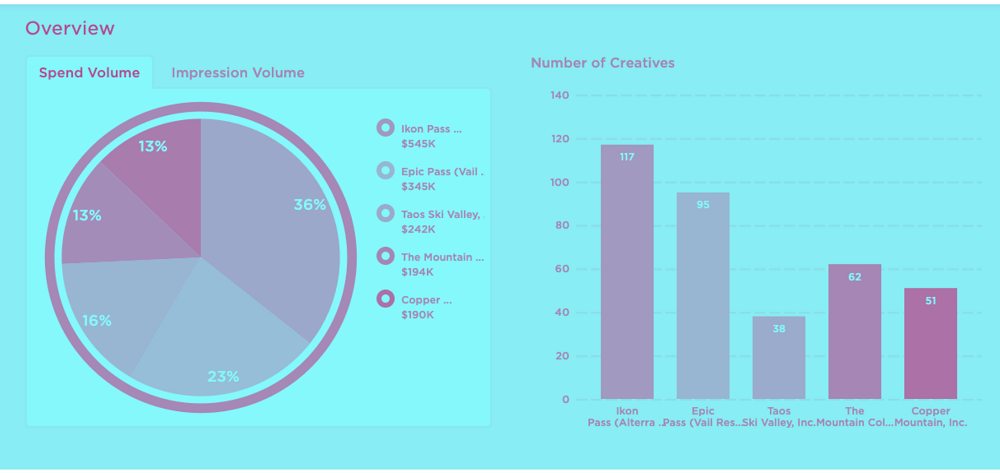
Ski and snowboard resorts were one of the first business categories to take a major hit during the first wave of COVID lockdown orders in March 2020. Now, in 2021, industry demand has slowly but surely recovered as domestic travel edges back up to pre-pandemic levels. Today, we'll review how the top three advertisers in the Ski Mountains, Lodges & Resorts category from September until now have ramped up their advertising efforts to prepare for a highly anticipated 2022 winter season.
After explosive growth during the first phase of the pandemic, streaming companies needed to move fast to keep the buzz up in 2021. We’ve seen companies take different approaches to attract new customers and reduce churn. Netflix is investing heavily in original content, and with each big release, like global sensation Squid Game, it gathers more user data across categories as diverse as action blockbusters, Korean soaps, anime, sci-fi, Sundance films, zombie shows, and kids cartoons.
The expectation heading into Black Friday 2021 was that while the day would continue to drive significant traffic peaks, it was unlikely to reach the standards set in years past. And early data from Black Friday appears to prove this idea correct. Visits for most retailers were up significantly compared to a 2020’s limited Black Friday, but down compared to the equivalent day in 2019 – although there were exceptions to this rule. Walmart saw a 2.8% visit increase, and Target just a 3.1% decline compared to 2019.
As we approach the end of the year, we’ll be covering trends from 22 key markets. We’ll recap what each industry has experienced over the past year and what to watch for in 2022. Learn who are the top advertisers from each category and how they spend across formats. If you went shopping for a car this past year, the price tags probably made you hit the brakes. Since the beginning of the pandemic, used car prices rose 39.8%, while new car prices rose 8.9%, according to the US Bureau of Labor Statistics.
When it comes to analyzing holiday sales, Consumer Edge data can be extremely helpful in tracking what has happened holiday-to-date. It becomes even more powerful when users take advantage of data on last year’s sales trajectory to forecast how the rest of the season may play out. In today’s Insight Flash, we compare holiday sales trends in the US and the UK in 2019 and 2020 to understand which subindustries are most levered to this time of year and how much holiday shopping will have already been included when our Black Friday data should become available for the majority of US retailers tomorrow
The lower tranches of MSBAM 2013-C10 have been in trouble since the beginning of the pandemic. Fitch details their latest downgrade in their last update at the end of September. In particular, the downgrade is due to the troubles at Westfield Citrus Park, which is in a friendly foreclosure; Southsdale Center; and the Mall at Tuttle Crossing. Let’s look at these centers in sequence. According to Fitch, Westfield Citrus Park reported June 2021 TTM in-line sales of approximately $120 compared to $379 per sqft at YE 2019.
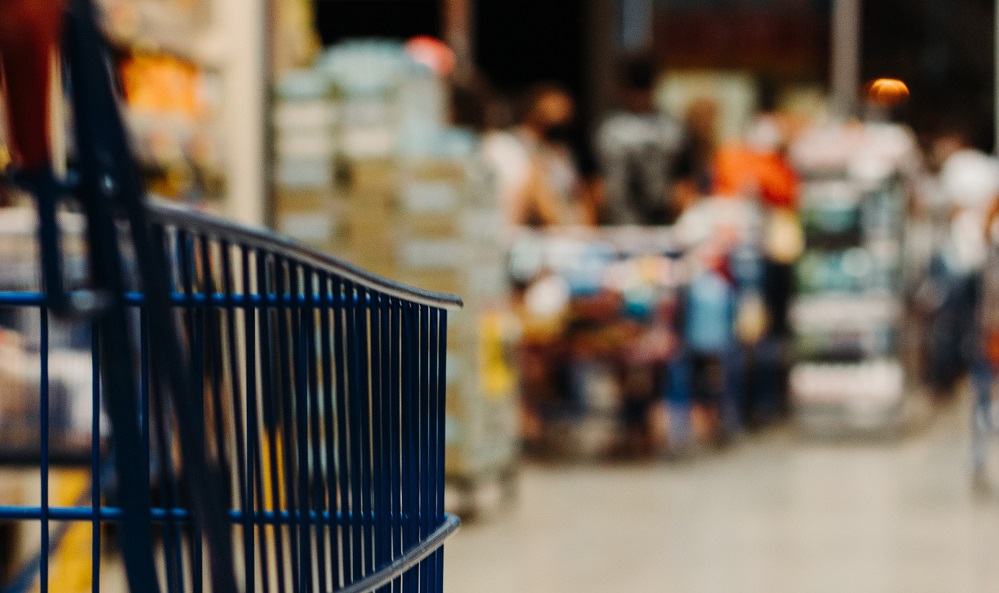
While most of the retail world looked anxiously towards Black Friday preparations and results, the grocery sector knows that a far more important day comes before – Turkey Wednesday. Turkey Wednesday marks the day before Thanksgiving when grocers around the country see a powerful visit surge – for some, the pinnacle of their annual visits. How did this key supermarket holiday play out in 2021, and which other sectors benefited?
Notable Hit 1: (BURL:NYSE) On Tuesday November 23 , 2021 Burlington Stores, Inc. (BURL) posted better-than-expected revenues of $2.3bn beating the consensus estimate of $2.22bn or by 3.44% and in the same direction as Advan's forecasted sales. The revenue was up 38.19% YoY - Advan's foot traffic data captured an increase in foot traffic of +24.53% YoY at its stores for Q3 2021. As a result of beating the sales and EPS, the stock opened at $271.99, up 3.4% from its previous day's closing price.
As we approach the end of the year, we’ll be covering trends from 22 key markets. We’ll recap what each industry has experienced over the past year and what to watch for in 2022. Learn who are the top advertisers from each category and how they spend across formats. The video game industry had an exciting, yet strange, year. Many great games came out. Sales were up 12% year-over-year. But major companies believe supply chain issues will begin to hamper sales. Nintendo has urged shoppers to begin holiday shopping early.
After the holidays? Beginning of the new year? Or once things settle down? What is the best time of the year to look for a new job? Well, by analyzing the start dates on profiles, we see that it depends a lot on the industry. The following calendar shows the frequencies of newly filled positions for each industry by month:
It’s been a long two years. Last year at this time, many of us were hoping for a quick pandemic-rebound in 2021. Couldn’t we just magically put the pandemic behind us and forge a new way forward? We know that didn’t happen. With the Delta variant and a complicated economic recovery, 2021 was marked by continued reliance on digital shopping, work, schooling and entertainment. At the same time, we experienced the “Great Resignation” and major supply chain issues.
I don't know about you, but cutting the cord was quite a daunting task that I chose to take on earlier this year (apparently I am very late to the party). How would I possibly survive without being able to watch the Patriots every Sunday, and the Bachelor every Monday? Thanks to a strong internet connection and Live TV streaming apps, I never had to find out. Live TV streaming apps have grown in popularity as they allow fans to stream their favorite shows and sports live, without needing to pay for an additional cable service.
In 2020, several big-box chains announced that they would close their retail locations on Thanksgiving Day due to the ongoing COVID-19 pandemic. One year later, some of those same companies—including Walmart, Target, and Best Buy—will remain closed again on Thanksgiving. Consumer transaction data reveals that among the three companies, Walmart saw the most significant decrease in year-over-year sales the week of Thanksgiving in 2020. At the same time, Best Buy saw a major shift to online sales during that week while most sales at Walmart and Target still took place through retail channels.
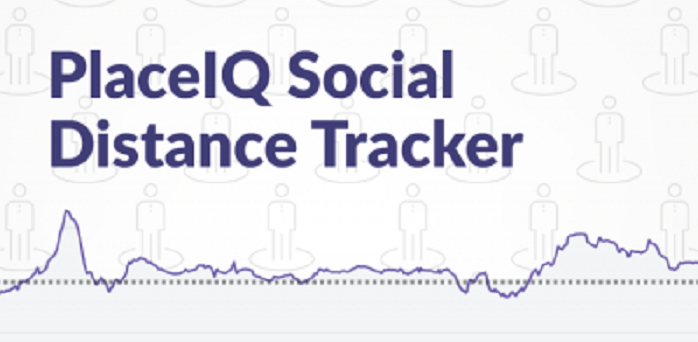
Foot traffic has been relatively up and stable since the decline of our initial Delta case wave and the conclusion of the back-to-school season. From October onward, things are pretty flat. Grocery is the category we want to discuss today -- that yellow line in the middle of the pack. It nicely encapsulates the complex mix of behaviors in the market right now, as some people return to their old behaviors, others stick with their new ones, and the remainder find a happy middleground.This dynamic -- the presence of old normals, new normals, and hybrid normals _all at once_ -- is showing up in every category we track. Understanding and serving this dynamic is key to winning this holiday season and beyond.
Our latest white paper checks in with one of the pandemics major winners – the grocery sector. Following our Summer Grocery update, we dove into nationwide, regional, and brand-level visit data to understand what has changed and what has returned to pre-pandemic patterns. Year-over-two-year (Yo2Y) grocery visits have been consistently up nationwide in recent months, with weekly visits in October surpassing 2019 numbers by 5.2%, 7.1%, 7.2%, and 9.3% for the weeks of October 4th, 11th, 18th, and 25th, respectively.