For this week, total U.S. weekly rail traffic was 538,184 carloads and intermodal units, up 30 percent compared with the same week last year. Total carloads for the week ending April 24 were 240,075 carloads, up 25 percent compared with the same week in 2020, while U.S. weekly intermodal volume was 298,109 containers and trailers, up 34.3 percent compared to 2020.
In the early days of the legal cannabis industry, public companies were concentrated in Canada where regulated marijuana sales were first allowed. Investors in both Canada and the United States poured investment into these stocks with the hope that Canadian companies could expand in the US as more states legalized medical and adult use. However, as piecemeal licensing regimes have rolled out, Canadian players have struggled to maintain an edge against newer US companies. Viscacha Data sheds some light on the latest in US versus Canadian pot stocks in this analysis drawing upon our realtime sales dataset covering over 25% of dispensaries across the US and Canada.
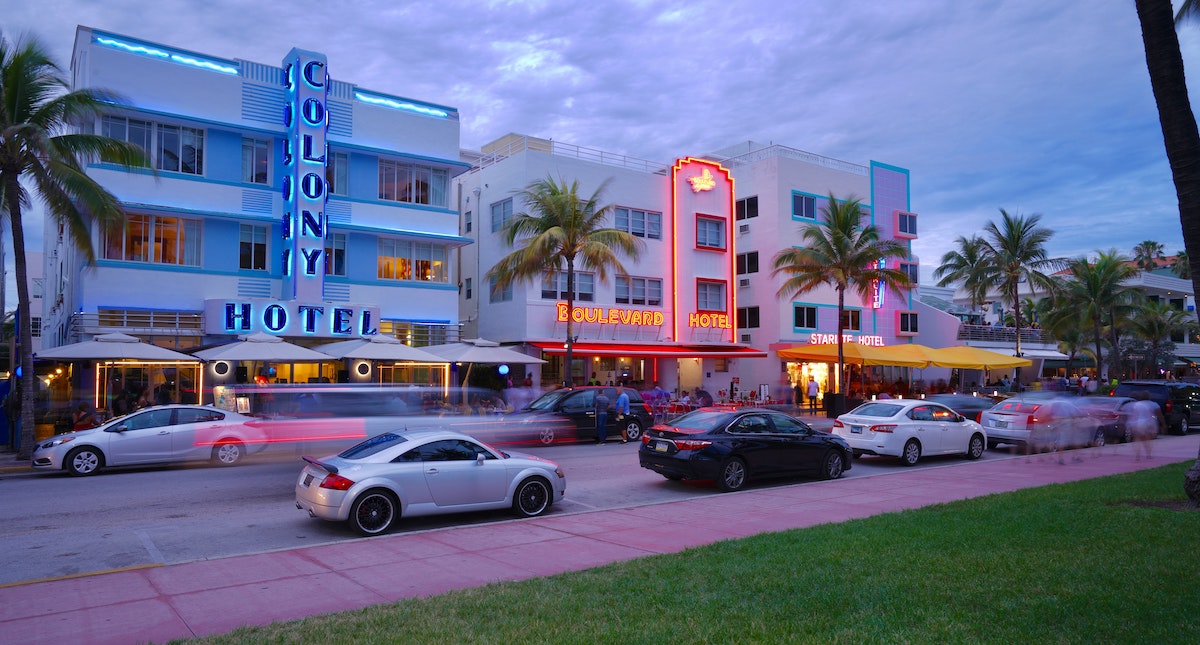
Spring Break 2021 didn’t just dive in, it made a cannonball-sized splash for Florida hotels and other U.S. destinations. When looking at STR’s School Break Report, 39% of college students and just 7% of K-12 students were on break beginning 6 March. Despite this slightly low percentage, all signs pointed to a strong spring break period right out of the gate. The STR-defined Florida Keys market, at that point, was the only U.S. market to reach an 80% occupancy level—at 85.9% for the opening week of March. Other markets, such as Sarasota (75.4%), Fort Lauderdale (72.5%) and McAllen/Brownsville, TX (70.5%), were lower but all above the 70% mark.
In this Placer Bytes, we dive into Starbucks and its impressive recovery and the resiliency of New York retail. As if another reminder was necessary, the latest metrics from Starbucks have reiterated the problematic nature of betting against the brand. Looking at weekly visits year over year shows that the significant declines seen throughout the pandemic have normalized with visits up throughout March. And while this is clearly a misleading metric, they do signify the rebound.
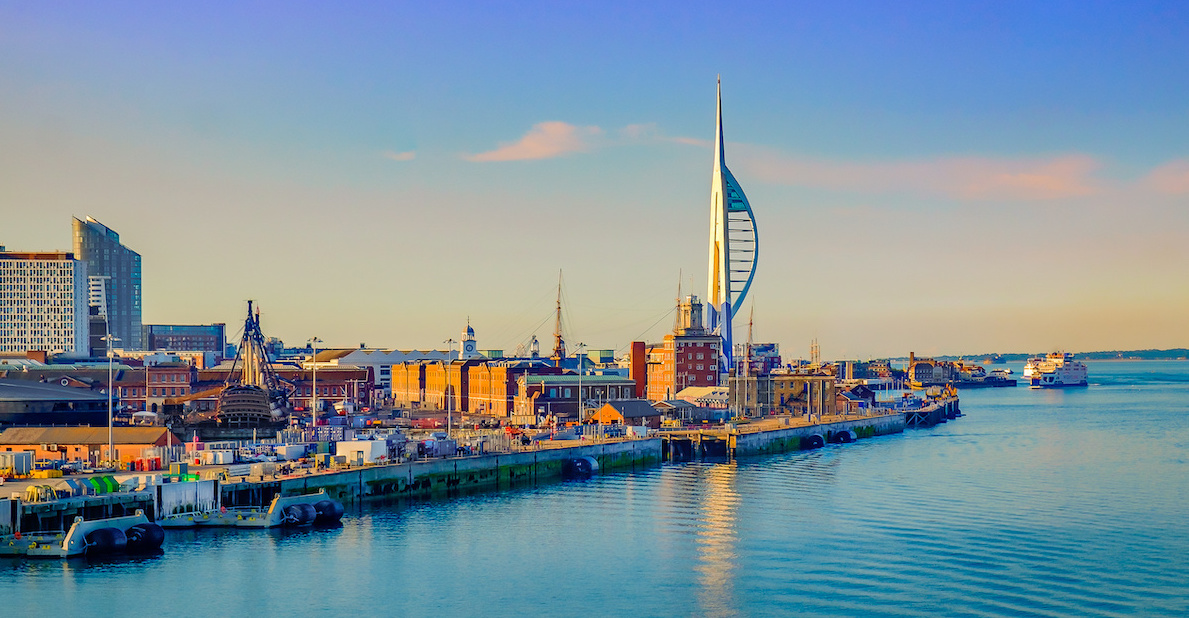
Non-essential retail in Portsmouth was among the busiest in the South East of England after non-essential retail reopened on April 12th, with data from Huq Industries’ Community Vision product revealing the cities that bounced back fastest in the first full week. Community Vision, Huq’s high-street measurement tool for local Councils, measures footfall, catchments and other essential KPIs in order that towns and cities can follow and optimise the recovery from Covid-19 on a near-realtime basis.
With international and business travel caught in the everchanging crossfire of quarantine rules and other COVID-19 restrictions, staycations became a significant driver of the occupancy gains that have emerged since the beginning of the pandemic. STR’s Tourism Consumer Insights team continues to keep a close eye on traveler and tourism trends as the industry moves through the most optimistic point of the pandemic. The twists and turns of the pandemic have contributed to seismic changes in tourism. In this latest installment of our Tourism After Lockdown blog series, we evaluate post-pandemic recovery scenarios for domestic and international leisure travel.
From serving as the one-year mark since the onset of the pandemic in the U.S. to potentially highlighting the beginning of retail’s return to normalcy, Q1 was very important. One of the most significant trends in Q1 retail was signs that normal shopping patterns were returning. In the apparel space, our Q1 Quarterly Index showed that weekend visit percentage rose for the third quarter in a row with a quarter-over-quarter jump of 10%. This is critical as many apparel players rely on shoppers being willing to spend more time getting to a regional mall in order to drive sales.
With a year passed since the start of the pandemic, people have shifted where they work, travel, and live. Using our foot traffic data, we refreshed our October analysis on the COVID-driven Urban Exodus, and analyzed whether this migration out of urban centers has continued to last, or whether people are now returning back to their pre-COVID urban life. We looked at particular urban cohorts pre-pandemic, and analyzed what share of each cohort moved away, where they moved to, and how many have since returned. We replicated this analysis in the prior year (i.e. cohorts from before March 2019) in order to establish and compare the COVID-driven migration and return to a benchmark of “normal” migration patterns exhibited in the data. We believe that the difference between 2020 vs. 2019’s migration is the appropriate way to measure any COVID-driven changes, and is the methodology we employ throughout the analysis.
Consumer transaction data reveals that theme parks across the U. S. have been on the road to recovery, with both ticket sales and customer counts on the rise, after having been hit hard by shelter-in-place orders in March 2020. The industry witnessed a 55 percent decline in sales year-over-year in March 2020, and has since bounced back with 92 percent year-over-year sales growth in March 2021. Theme parks saw observed customers fall by a lesser magnitude year-over-year between April to September of 2020. The monthly average year-over-year growth in observed customers stood at -69 percent compared to -77 percent for observed sales, a trend that was perhaps due to parks looking to alternative ways of maintaining customer traffic, like Disney World’s NBA bubble.
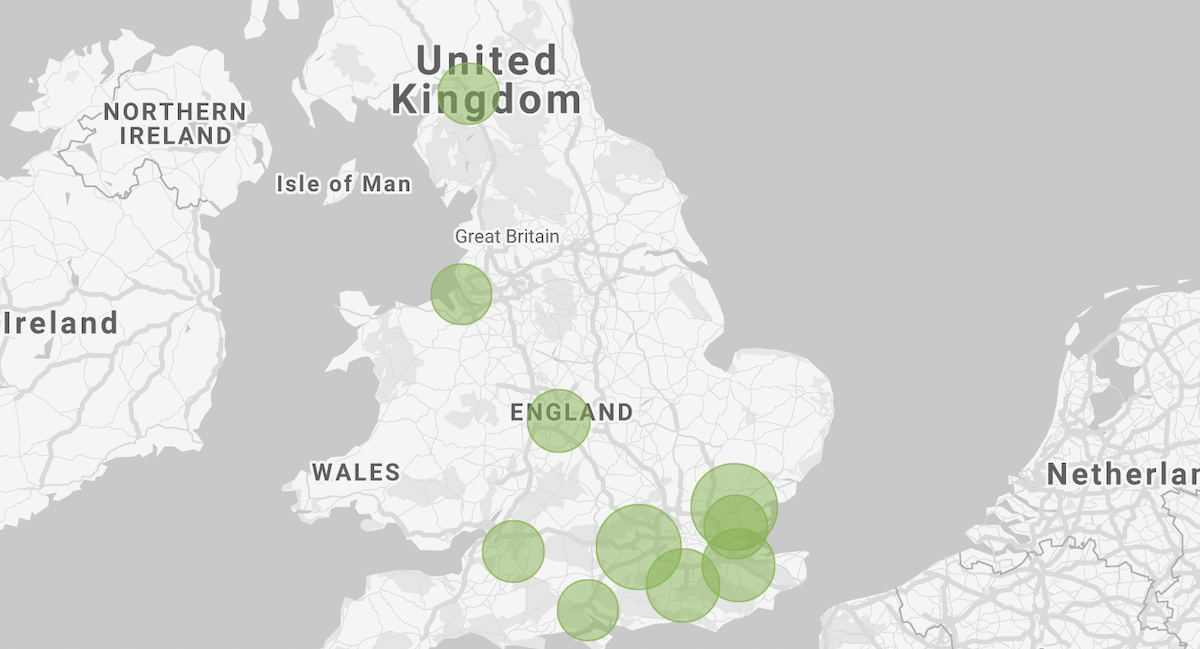
To mark the re-opening of non-essential retail last week, Huq has used insights from Community Vision, it’s high-street measurement tool for local Councils, to chart the recovery of the top and bottom towns and cities across England and Wales. The data measures both pedestrian footfall and in-store visits to non-essential outlets across 10,000+ high-streets between Monday 5th and Saturday 17th April, aggregated to the city level. Chelmsford in Essex has topped the list for footfall growth since non-essential retail’s reopening, with an increase of 71.9% over the first week. However, while Chelmsford has been busy in terms of footfall, Exeter has in fact seen the greatest rise in non-essential store visits, with levels almost tripling in the week (up 227.3%) – albeit from a small base.
In this Placer Bytes, we dive into Disney’s theme park recovery and analyze whether to jump back on the Whole Foods or Trader Joe’s bandwagon. Disney World is back on the upswing after seeing visits in January and February down just 49.8% and 53.6% year over year, respectively. This is about the level the theme park had been at since the late summer. While visits were actually up 33.8% in March, the number is misleading because it is being compared to a month in 2020 that already saw COVID-related closures.
Continuing a trend we saw throughout the COVID-19 pandemic, morning commute traffic is still far below pre-COVID levels in terms of trips and vehicle-miles traveled. Nationally, VMT exceeded pre-COVID levels beginning in late February and continuing through April. In the last few weeks, trips taken by drivers in the United States have increased on a slight upward trajectory. Yet some areas are seeing fewer VMT and trips than their counterparts. For example, trip growth in Washington DC, New York and Seattle continue to lag Phoenix, Dallas and Miami. Even within metro areas, the number of trips taken varies considerably by time of day.
A strong return of leisure travel has created much cause for celebration during the early months of 2021. In the U.S., hotel room demand in March was the country’s highest level recorded since the start of the pandemic. To fully recover, however, the industry needs both leisure and the various segments of business travel to return. To track evolving trends in the tourism and hospitality industry, and examine everchanging attitudes to travel, STR conducted a quantitative survey in February 2021 among 1,333 respondents from its Traveler Panel. In this latest installment of Tourism After Lockdown, we look at the potential recovery path of business travel. In this research, travelers primarily represented the United Kingdom, other countries in Europe, and North America. Sentiment about business travel was captured among those who had previously traveled for business pre-pandemic.
The volume of transits through the UK’s ports of entry since March 1st has tracked consistently at 10-15pts above January 2020 levels, while at the same time delays have returned to ’normal’ levels. This suggests that UK ports are performing more efficiently than at any time during the last year and a quarter, as the time taken to process transits has decreased by up to 15%.
The week of 4-10 April was all about demand. The number of U.S. room nights sold surged to 22 million, which was the most since the start of the pandemic. As a result, occupancy reached 59.7%, also the highest level of the past year. On a total-room-inventory (TRI) basis, which includes temporarily closed hotels because of the pandemic, U.S. occupancy reached 56.6%—yes, that was another pandemic-era high. On average, the industry sold 3.2 million rooms per day during the week. A year ago, daily demand was a third of that.
The grocery sector experienced a fundamental shift during the pandemic, and while the changes were generally good for most brands, others were very poorly positioned. And these differences largely centered around critical changes in consumer behavior that elevated certain brands because of distinct characteristics. As an example, traditional grocery brands saw a significant advantage as they enabled customers to do more with a single visit and were well aligned with mission-driven shopping. And while many of these changes are likely to normalize over the coming months, some may have a surprising amount of staying power. Should these prove capable of continuing, as new factors arise from lingering COVID effects, some brands could be extremely well positioned for the coming months.
U.S. consumer spending has been altered by the coronavirus pandemic. Our data reveals that consumers are changing the way they pay for goods and services, with some industries seeing spending shift toward online purchases. Additionally, the pandemic has changed the types of purchases consumers are making, with stimulus recipients increasing their spending on big-ticket items. By analyzing industry-level data, consumer spending trends can provide insight into which sectors of the economy are recovering fastest. Overall, consumer spending in March 2021 versus the same month in 2020 is up 27 percent across all sectors, an aggregation of over 5,200 major U.S. companies. Compared to February, March’s year-over-year growth is 14 percentage points higher.
Visits to the UK’s pubs spiked up to 60pts this week, with high-frequency geo-data showing how Monday’s easing is of restrictions has drawn millions to the nation’s beer gardens. The Huq Index had recorded only nominal visits to pubs since the start of the year, which can be largely attributed to staff and venues which offer takeaway food. However, following the first phase of hospitality’s reopening on Monday, Huq’s single day measure shows a jump of 60pts+ supporting reports that many have rushed to book outdoor tables.
Total construction starts rose 2% in March to a seasonally adjusted annual rate of $825.3 billion, according to Dodge Data & Analytics. A solid gain in nonresidential building starts fueled the March gain, while growth in residential starts was minuscule and nonbuilding starts fell outright. The Dodge Index rose 2% in March, to 175 (2000=100) from February’s 172.
As opportunities for watching sports have become more limited in the last year, opportunities for betting on sports have proliferated. Online gambling has been a popular activity since Americans first had internet access, but today’s Insight Flash digs deeper into specific recent trends including acceleration in the subindustry’s growth, loyalty to specific services, and how trends vary by US State. Since the beginning of 2019, spend for Online Gambling in the US has outpaced other Leisure and Recreation subindustries by a large margin.


