An unexpected side effect of the pandemic has been the extraordinary rise in home prices during 2021. That has increased the need for jumbo loans — mortgage loans that exceed the loan limits of Fannie Mae and Freddie Mac. When mortgage rates dropped at the onset of the pandemic in 2020, the effects were felt immediately in the market for conforming loans — mortgages that can be packaged into federally backed mortgage securities. Mortgage rates on jumbo loans were slower to come down and reached an all-time low during 2021.
There is a first time for everything, and such was the motto of some investors in the U.S. as they made their first purchases outside of their traditional geographic footprint in 2021. A list of the top markets for new entrants provides some insight as to where investors headed and what factors lured them there. For some first-time market participants, the decision to expand their geographic horizons had less to do with geography and more to do with access to a specific asset class.
National home prices increased 19.1% year over year in January 2022, according to the latest CoreLogic Home Price Index (HPI®) Report. The January 2022 HPI gain was up from the January 2021 gain of 9.4% and was the highest 12-month growth in the U.S. index since the series began in 1976. While home price growth is expected to slow over the next 12 months, the CoreLogic HPI Forecast shows that the year-over-year change in the HPI will remain in the double digits for at least the first seven months of 2022.
Interest in the multifamily commercial property sector has skyrocketed during the Covid era. Global investment volume in 2021 was almost double 2019’s level, with record spending in the U.S., U.K., Germany and Canada. Japan was one of only two major residential markets to buck this trend, tumbling year-on-year. Based on deal volume alone, it would seem that interest in the Japanese sector is receding. However, other indicators tracked by Real Capital Analytics and MSCI point in a different direction.
The CoreLogic Home Price Insights report features an interactive view of our Home Price Index product with analysis through January 2022 and forecasts through January 2023. CoreLogic HPI™ is designed to provide an early indication of home price trends. The indexes are fully revised with each release and employ techniques to signal turning points sooner. CoreLogic HPI Forecasts™ (with a 30-year forecast horizon), project CoreLogic HPI levels for two tiers—Single-Family Combined (both Attached and Detached) and Single-Family Combined excluding distressed sales.
Welcome to the March 2022 Apartment List National Rent Report. After a slight seasonal cooldown over the past few months, rent growth is back on an upward trajectory, with our national index up by 0.6 percent over the course of February. Even though month-over-month rent growth has moved back into positive territory, it remains substantially cooler than last summer, when rents grew by more than 2 percent per month for four straight months. Year-over-year rent growth currently stands at a staggering 17.6 percent, but most of that growth took place last spring and summer.
The nation’s overall mortgage delinquency rates have improved significantly over the last year, according to the latest CoreLogic Loan Performance Insights Report. Data shows the serious delinquency rate for November 2021 declined 1.9 percentage points from 12 months prior to 2%. When compared to the peak serious delinquency rate for mortgages in August 2020, the rate last November was down 2.3 percentage points. Declines in local unemployment rates, a rapid rise in home prices and demand for housing have helped reduce the overall delinquency rate. Loan product mixes also contribute to the national delinquency rate, and this blog explores mortgage default trends by loan type.
U.S. single-family rent growth increased 12% in December 2021, the fastest year-over-year increase in over 16 years, according to the CoreLogic Single-Family Rent Index (SFRI). The index measures rent changes among single-family rental homes, including condominiums, using a repeat-rent analysis to measure the same rental properties over time. The December 2021 increase was more than three times the December 2020 increase, and while the index growth slowed in the summer of 2020, rent growth returned to its pre-pandemic rate by October 2020.
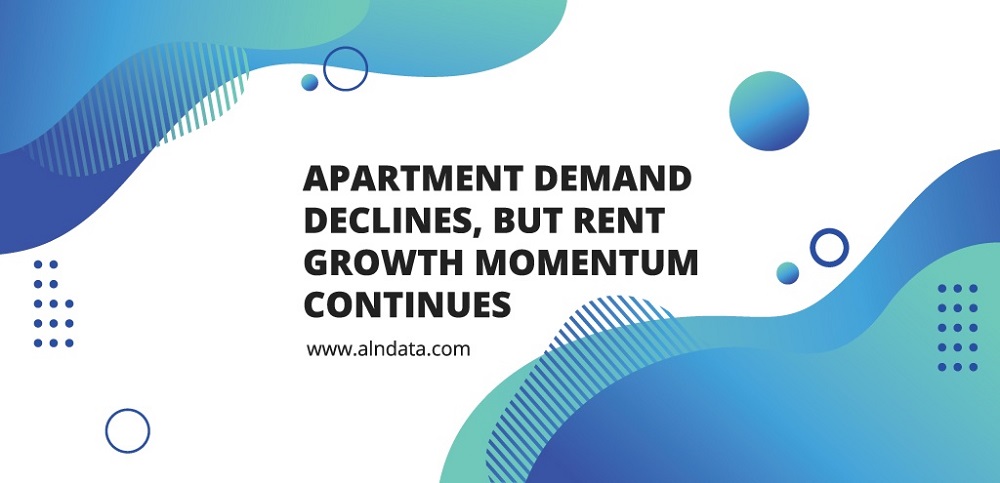
After a historic 2021 for the multifamily industry in which massive apartment demand drove average effective rent up by 15% nationally, the new year brought with it a change in dynamic. For one month at least, apartment demand was much lower than normal even as rent growth momentum continued upward. As usual, all numbers will refer to conventional properties of at least 50 units.
2021 was a year of staggering price growth on both the rental and for-sale sides of the housing market, but even before these recent spikes, housing affordability was already a major concern. Generally accepted wisdom holds that a household should not spend more than 30 percent of gross household income on housing costs (i.e. rent or mortgage payments) in order to maintain good financial health. However, as of 2019, nearly one-in-three American households spent above this threshold; these 36.5 million households are considered to be “cost-burdened.”
The nation’s overall delinquency rate was 3.6% in November. All stages of delinquencies showed year-over-year decreases in November.In November 2021, 3.6% of home mortgages were in some stage of delinquency (30 days or more past due, including those in foreclosure) , which was a 2.3-percentage point decrease from November 2020 according to the latest CoreLogic Loan Performance Insights Report. November marked the first time since the pandemic began that the overall delinquency rate fell below the March 2020 level.
The CoreLogic Loan Performance Insights report features an interactive view of our mortgage performance analysis through November 2021. Measuring early-stage delinquency rates is important for analyzing the health of the mortgage market. To more comprehensively monitor mortgage performance, CoreLogic examines all stages of delinquency as well as transition rates that indicate the percent of mortgages moving from one stage of delinquency to the next.
Since March 2020, the COVID relief program under the CARES Act allowed millions of homeowners to temporarily pause or reduce their mortgage payments. However, for many of these homeowners, the forbearance plans already expired or are expiring soon. The maximum forbearance period was 18 months for most of the programs. Thus, a loan that entered forbearance during April 2020 would have had to exit forbearance no later than October 2021. According to the Mortgage Bankers Association (MBA), the share of mortgage loans in forbearance decreased to 1.41% in December 2021, a drop of 26 basis points from 1.67% in the prior month.
Industrial construction and property prices in Canada are at record high levels, an observation we noted at the recent MSCI/REALPAC 2022 Canada Real Estate Investment Forum. If property markets simply mean reverted, at some point one would expect prices to decline. Instead, both price growth and investment in new industrial construction continued at a strong pace in 2021. This combination lends weight to the argument that there is a fundamental shift in the nature of demand for industrial space in Canada.
The CoreLogic Home Price Insights report features an interactive view of our Home Price Index product with analysis through December 2021 and forecasts through December 2022. CoreLogic HPI™ is designed to provide an early indication of home price trends. The indexes are fully revised with each release and employ techniques to signal turning points sooner. CoreLogic HPI Forecasts™ (with a 30-year forecast horizon), project CoreLogic HPI levels for two tiers—Single-Family Combined (both Attached and Detached) and Single-Family Combined excluding distressed sales.
National home prices increased 18.5% year over year in December 2021, according to the latest CoreLogic Home Price Index (HPI®) Report. The December 2021 HPI gain was up from the December 2020 gain of 8.9% and was the highest 12-month growth in the U.S. index since the series began in 1976. Price appreciation averaged 15% for the full year of 2021, up from the 2020 full year average of 6%. Home price growth in 2021 started off at 10% in the first quarter, steadily increasing and ending the year with an increase of 18% for the fourth quarter.
In addition to elevated demand for owner-occupied and second homes since the onset of the pandemic, there has also been an increase in investor home purchases across the U.S. housing markets. As the recent CoreLogic analysis showed, investor purchases accounted for about a quarter (26%) of all home purchases in the third quarter of 2021, up from 16% seen in 2019. Among investors, there has also been an increase in iBuyer home purchases in 2021. An iBuyer, or “instant buyer,” is a real estate company that uses technology to buy and resell homes quickly.
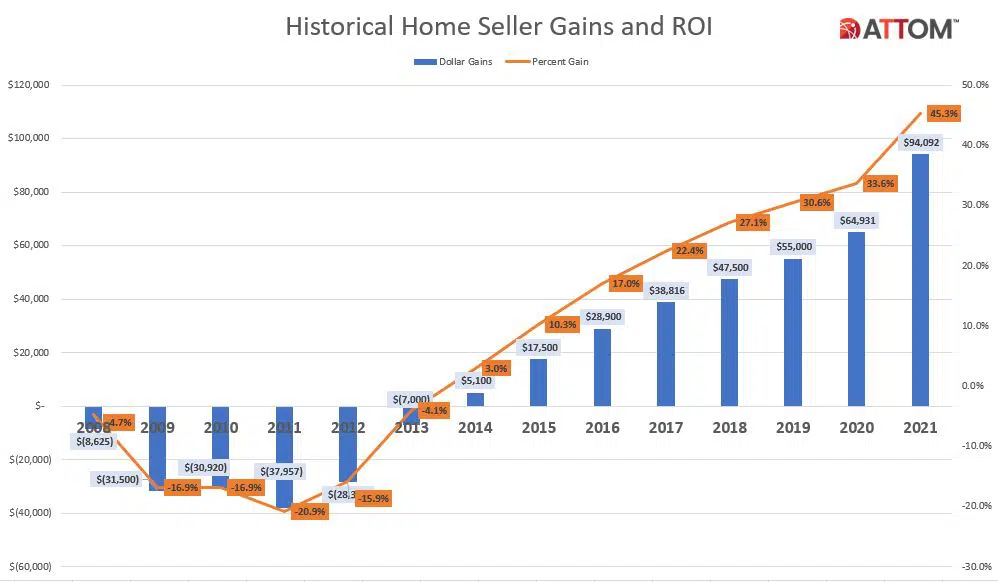
ATTOM, curator of the nation’s premier property database, today released its Year-End 2021 U.S. Home Sales Report, which shows that home sellers nationwide realized a profit of $94,092 on the typical sale in 2021, up 45 percent from $64,931 in 2020 and up 71 percent from $55,000 two years ago. Profits rose in more than 90 percent of housing markets with enough data to analyze and the latest figure, based on median purchase and resale prices, marked the highest level in the United States since at least 2008.
Welcome to the February 2022 Apartment List National Rent Report. After a slight dip to close out 2021, our national index ticked back up by 0.2 percent over the course of January. Even though month-over-month growth has moved back into positive territory, rent growth has still cooled substantially from last year’s peak. Year-over-year rent growth currently stands at a record-setting 17.8 percent, but over the past four months, rents have increased by a total of just 0.9 percent. Much of this cooldown is likely related to seasonal factors; it remains to be seen if rapid rent growth will return as moving activity picks back up in the spring and summer
The value of commercial and multifamily construction starts in the top 20 metropolitan areas of the U.S. increased 18% from 2020 to 2021, according to Dodge Construction Network. Nationally, commercial and multifamily construction starts increased 16% in 2021. In the leading half (the top 10 metro areas), commercial and multifamily starts rose 18% in 2021, with two metro areas, Washington, DC, and Los Angeles, CA, posting a decline. In the lesser half of metro areas (those ranked 11 through 20), commercial and multifamily starts rose 17% in 2021, with Chicago, IL, and Nashville, TN, losing ground from 2020.


