The Case-Shiller methodology is the established standard for measuring home price growth. This is for good reason. Contrast it with the second most common method: the median. The median comes with the substantial flaw that it can change because different types of homes are selling, and not because they are appreciating. The Case-Shiller methodology avoids this by comparing a homes’ sale price in one sale compared to its previous sale.
U.S. single-family rent growth increased 11.5% in November 2021, the fastest year-over-year increase in over 16 years, according to the CoreLogic Single-Family Rent Index (SFRI). The index measures rent changes among single-family rental homes, including condominiums, using a repeat-rent analysis to measure the same rental properties over time. The November 2021 increase was more than three times the November 2020 increase, and while the index growth slowed in the summer of 2020, rent growth returned to its pre-pandemic rate by October 2020.
Historically, large-balance mortgage loans, known as ‘jumbo’ loans, have had a higher interest rate than conforming loans. However, since mid-2013, the interest rate for a jumbo loan was lower than a conforming loan until June 2020. Low interest rates during the pandemic didn’t benefit homebuyers with jumbo loans the same way as it did homebuyers with conforming loans. While the conforming mortgage interest rate dropped to record lows in 2020, the jumbo-to-conforming mortgage rate spread widened and jumbo loans became relatively more expensive than conforming loans.
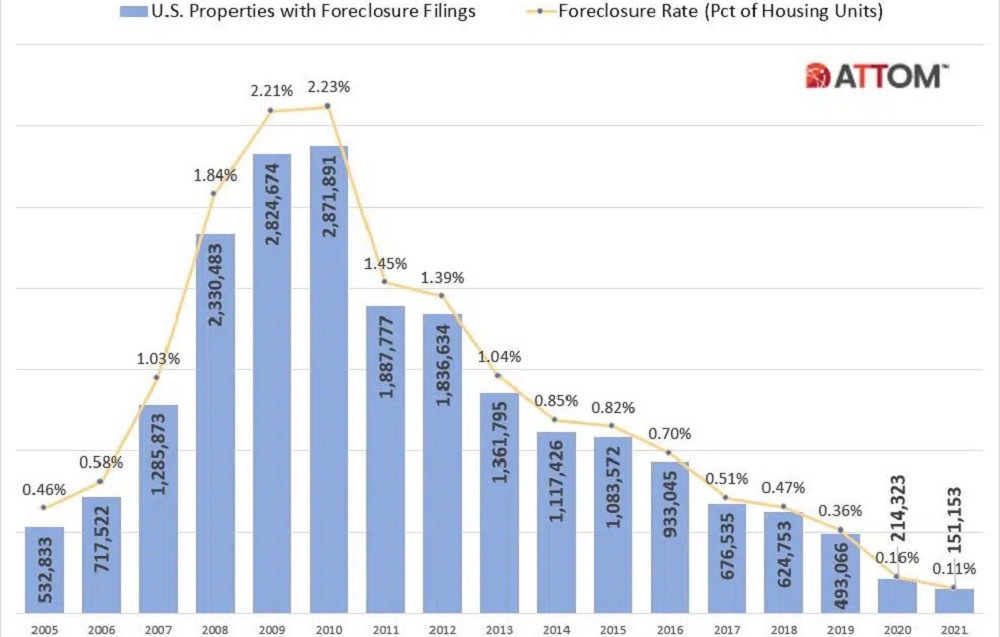
ATTOM, licensor of the nation’s most comprehensive foreclosure data and parent company to RealtyTrac (www.realtytrac.com), the largest online marketplace for foreclosure and distressed properties, today released its Year-End 2021 U.S. Foreclosure Market Report, which shows foreclosure filings— default notices, scheduled auctions and bank repossessions — were reported on 151,153 U.S. properties in 2021, down 29 percent from 2020 and down 95 percent from a peak of nearly 2.9 million in 2010, to the lowest level since tracking began in 2005.
In October 2021, 3.8% of home mortgages were in some stage of delinquency (30 days or more past due, including those in foreclosure), which was a 2.3-percentage point decrease from October 2020 according to the latest CoreLogic Loan Performance Insights Report . Comparatively, the overall delinquency rate in October 2019 was 3.7%. The share of mortgages that were 30 to 59 days past due — considered early-stage delinquencies — was 1.2% in October 2021, down from 1.4% in October 2020. The share of mortgages 60 to 89 days past due was 0.3% in October 2021, down from 0.6% in October 2020.
The CoreLogic Loan Performance Insights report features an interactive view of our mortgage performance analysis through October 2021. Measuring early-stage delinquency rates is important for analyzing the health of the mortgage market. To more comprehensively monitor mortgage performance, CoreLogic examines all stages of delinquency as well as transition rates that indicate the percent of mortgages moving from one stage of delinquency to the next.
The U.S. has experienced record annual home-price growth with faster appreciation for detached houses than attached homes. A similar pattern has occurred for rent growth, and that experience is not unique to the U.S. The CoreLogic Single-family Rent Index has found an acceleration in annual rent growth to the highest recorded since the series’ inception in 2005. The double-digit rise of the past year is eight percentage points faster than measured one year earlier. Likewise, the CoreLogic Hedonic Rental Index for Australia has also accelerated a similar amount.
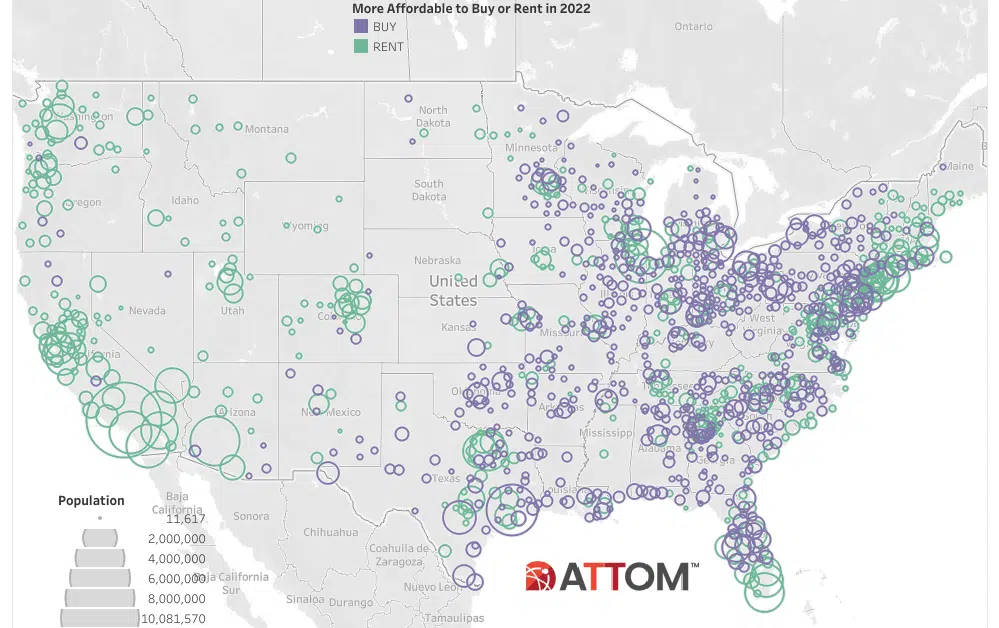
According to ATTOM’s just released 2022 Rental Affordability Report, home ownership remains more affordable than renting, even though median home prices have increased more than average rents and more than averages wages in 88 percent of U.S. counties analyzed. ATTOM’s 2022 rental affordability report shows that owning a median-priced home is more affordable than the average rent on a three-bedroom property in 58 percent of the counties analyzed.
Investors have been looking to alternative asset classes such as life sciences properties as demand trends for traditional investments like offices and retail face uncertainty. Location may not matter as much moving forward for those traditional asset classes; for life sciences assets though, investors are focusing on specific markets. Location may matter for life sciences assets for now, but not forever. The life sciences sector is heavily dependent on knowledgeable workers trained in arcane matters of biology.
ATTOM, curator of the nation’s premier property database, today released its 2022 Rental Affordability Report, which shows that owning a median-priced home is more affordable than the average rent on a three-bedroom property in 666, or 58 percent, of the 1,154 U.S. counties analyzed for the report. That means major home ownership expenses consume a smaller portion of average local wages than renting. Home ownership remains more affordable even though median home prices have increased more than average rents and more than averages wages in in 88 percent of the counties analyzed.
Welcome to the first Apartment List National Rent Report of 2022. Our national index fell by 0.2 percent during the month of December, marking the only time in 2021 when rents declined month-over-month. A slight dip in rents at this time of year is typical of seasonality in the market, but it’s especially notable after a year of record-setting growth. Over the course of calendar year 2021, the national median rent increased by a staggering 17.8 percent. To put that in context, annual rent growth averaged just 2.3 percent in the pre-pandemic years from 2017-2019.
National home prices increased 18.1% year over year in November 2021, according to the latest CoreLogic Home Price Index (HPI®) Report . The November 2021 HPI gain was up from the November 2020 gain of 8.1% and was the highest 12-month growth in the U.S. index since the series began in 1976. The increase in home prices was fueled by low mortgage rates, low for-sale supply and an influx in homebuying activity from investors. Projected increases in for-sale supply and moderation in demand as prices grow out of reach for some buyers could slow home price gains over the next 12 months.
The CoreLogic Home Price Insights report features an interactive view of our Home Price Index product with analysis through November 2021 and forecasts through November 2022. CoreLogic HPI™ is designed to provide an early indication of home price trends. The indexes are fully revised with each release and employ techniques to signal turning points sooner. CoreLogic HPI Forecasts™ (with a 30-year forecast horizon), project CoreLogic HPI levels for two tiers—Single-Family Combined (both Attached and Detached) and Single-Family Combined excluding distressed sales.
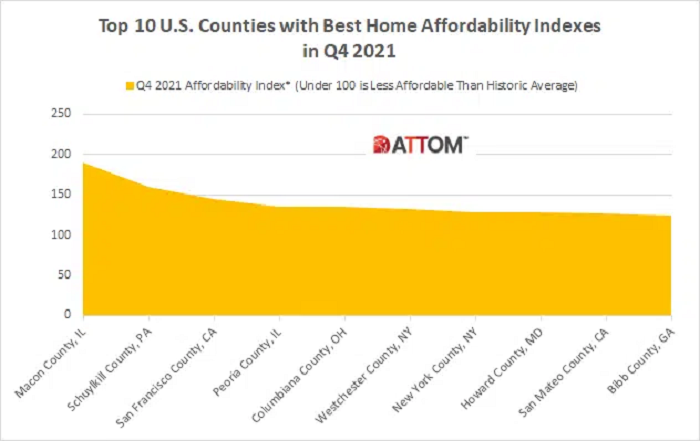
ATTOM’s just released Q4 2021 U.S. Home Affordability Report shows the latest pattern in home affordability – home prices still manageable, but getting less affordable – has resulted in major ownership costs on the typical home consuming 25.2 percent of the average national wage of $65,546. According to ATTOM’s latest home affordability analysis, the percent of wages needed to buy a median-priced single-family home is up from 24.4 percent in Q3 2021 and 21.5 percent in Q4 2020.
U.S. single-family rent growth increased 10.9% in October 2021, the fastest year-over-year increase in over 16 years\[1\], according to the CoreLogic Single-Family Rent Index (SFRI). The index measures rent changes among single-family rental homes, including condominiums, using a repeat-rent analysis to measure the same rental properties over time. The October 2021 increase was more than three times the October 2020 increase, and while the index growth slowed last summer, rent growth is running well above pre-pandemic levels when compared with 2019.
Location ... location ... location. It’s a constant refrain in real estate and, by extension, the hotel industry. The turn of phrase took on a whole new meaning in the wake of the COVID-19 pandemic. Depending on orientation, some hotels thrived, some survived, some shuttered and some didn’t survive. Asset type also had consequence. Full-service hotels situated in downtown locations with ample meeting space and F&B outlets were a victim of circumstance and did not fare well on a profitability continuum.
Singapore’s commercial real estate investment market has enjoyed a strong rebound in 2021 after sliding to its second lowest annual tally for deal volume in 2020. Including pending deals slated to close before the end of the year, 2021 investment is just shy of the 2017-19 yearly average and marks the second best annual total on record. The bounceback is notable for a couple of reasons. For one, Singapore’s resurgence hasn’t been overwhelmingly driven by the industrial and apartment sectors, as in other leading economies.
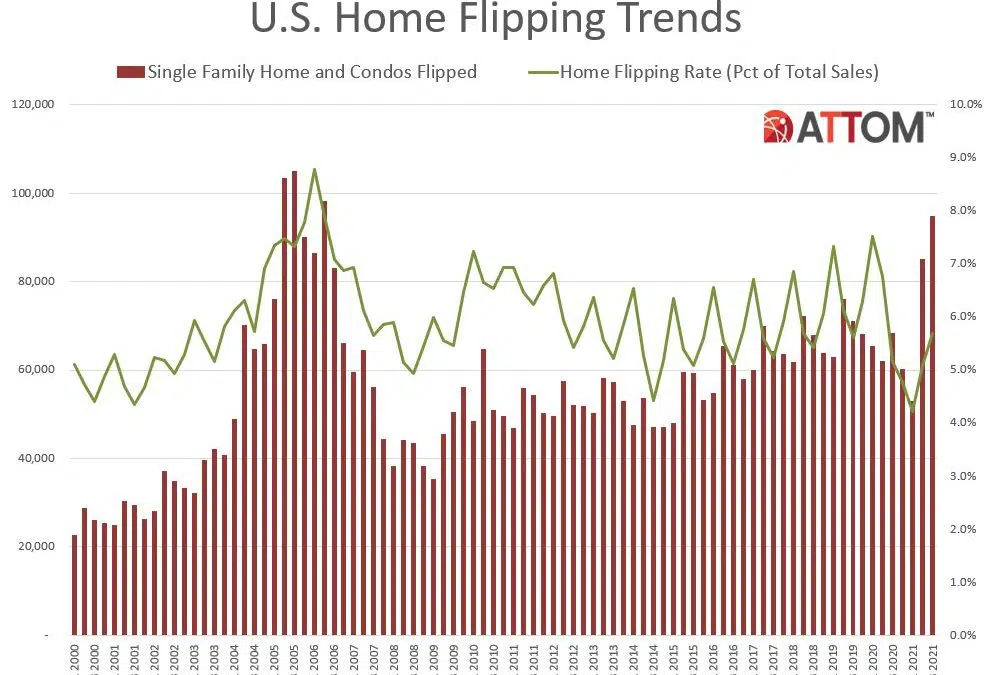
ATTOM, curator of the nation’s premier property database, today released its third-quarter 2021 U.S. Home Flipping Report showing that 94,766 single-family houses and condominiums in the United States were flipped in the third quarter. Those transactions represented 5.7 percent of all home sales in the third quarter of 2021, or one in 18 transactions, a figure that was up for the second quarter in a row after a year of declines.
People tend to fight the last war. This truism applies to many aspects of life where people assess problems by interpreting them in light of previous bad experiences. The Covid-19 crisis and the resulting recovery in investment activity into 2021 makes a great case for never following this simple behavior. The Covid-19 crisis led to a flurry of fund announcements where investors planned to use the distressed investment playbook that worked so well after the Global Financial Crisis (GFC).
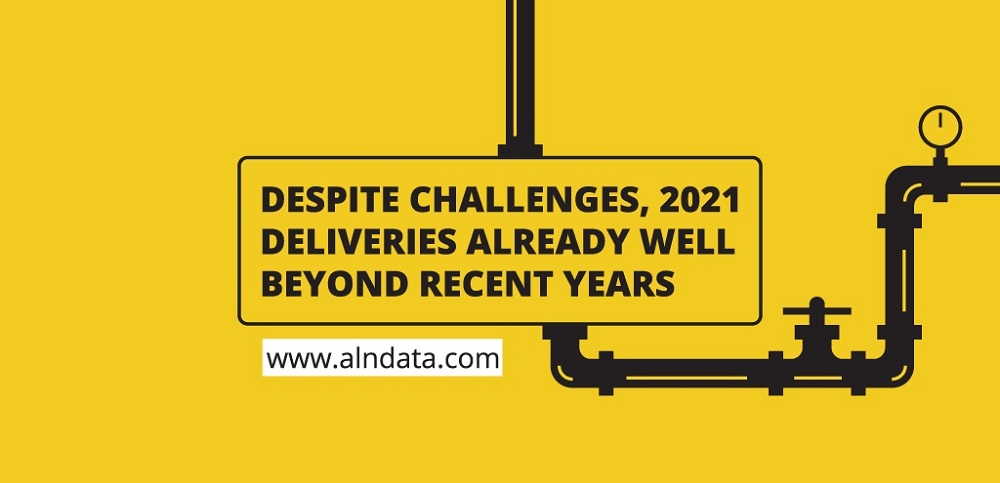
With 2021 coming to a close, and with apartment demand and rent growth rightly garnering a lion’s share of the attention, it is time to check in one last time this year on the new construction pipeline. Despite supply chain challenges and labor shortages, more new units were delivered through November of this year than in any recent complete year – and by a sizable margin. Nationally, about 325,000 new units were delivered through eleven months of 2021.


