Used cars were flying off the lots this year—and in the face of surging prices. Used car prices are about 42% higher than they were in the first quarter of 2020. The price gap between new and used cars has shrunk rapidly since November of 2020, when the difference was 10.8%. This summer, on average, a gently-used vehicle cost only 3.1% less than its new counterpart. In some cases, available and in-demand used models went for more than their new counterparts.
The CoreLogic Homeowner Equity Insights report, is published quarterly with coverage at the national, state and Core Based Statistical Area (CBSA)/Metro level and includes negative equity share and average equity gains. The report features an interactive view of the data using digital maps to examine CoreLogic homeowner equity analysis through the third quarter of 2021. Negative equity, often referred to as being “underwater” or “upside down,” applies to borrowers who owe more on their mortgages than their homes are worth.
Soaring home prices over the past year boosted home equity wealth to new highs through Q3 2021. The amount of equity in mortgaged real estate increased by $3.2 trillion in Q3 2021, an annual increase of 31.1%, according to the latest CoreLogic Equity Report . The average annual gain in equity was $56,700 per borrower, which was the largest average equity gain in at more than 11 years, and more than three times the gain from a year earlier.
Access to mortgage credit in underserved areas has always been one of the major concerns for housing policy experts and community activists. In previous years, Home Mortgage Disclosure Act (HMDA) data has been used to assess at what level the mortgage service needs in these communities are met. Though HMDA data is the most comprehensive publicly available detail on home mortgage loans across the U.S. residential mortgage market the data is dated when released only on an annual basis.
As uncertainty and new cases of the Omicron variant increase across the globe, some countries have reimplemented restrictions around travel. New restrictions obviously mean potential challenges for the hotel industry, and as we have seen throughout the pandemic, every class of hotel can be affected differently. In this latest piece, we look at how Luxury class hotels have performed around the globe, especially in more recent months.
With employees continuing to return to offices, ongoing vaccination progress, and the reopening of many international borders, the time would seem to be ripe for the return of business travel. Yet, even before the news of Omicron in recent days, there continued to be negative sentiment about the return of this segment whereas pandemic-era leisure travel sentiment remains buoyant. In November 2021, STR undertook an online survey of its Traveler Panel—an engaged audience of travel consumers—to examine the fortunes of the industry at this uncertain time.
As this year draws to a close, we dove into foot traffic trends for Nike, Under Armour, Athleta, and Lululemon to understand where the athletic apparel industry is headed. We have written about the current trend of digitally native DTC brands expanding into brick and mortar. But another, no less significant trend is underway – brands with extensive wholesale partnerships reducing the number of third-party distributors to focus on DTC brick and mortar and digital distribution channels.
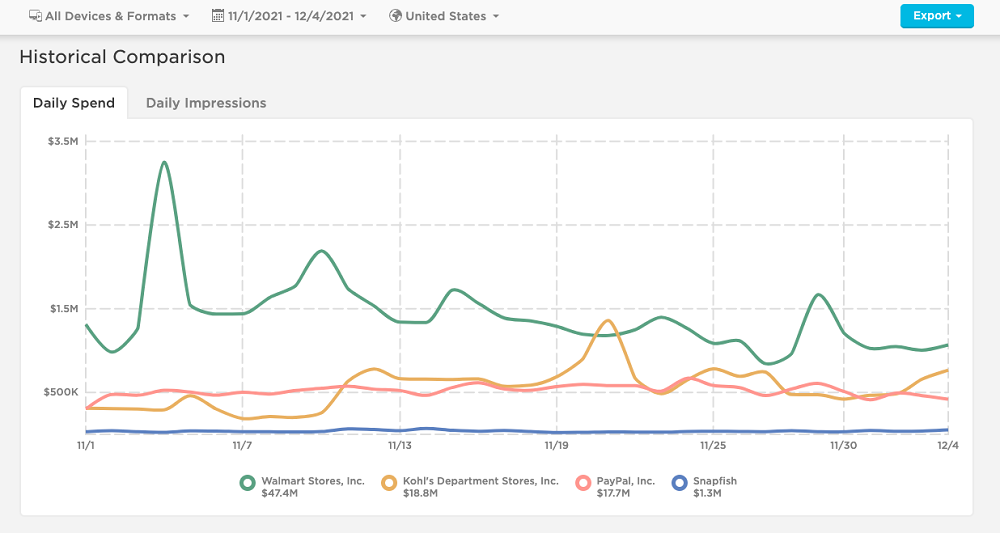
Following a record-breaking year for eCommerce, retailers are itching to get consumers to shop more than ever ahead of the holiday sale season. With a looming supply chain crisis, brands like Walmart, Kohls, Snapfish and more, have gone full throttle, encouraging consumers to buy earlier than ever this year. Since mid-October, digital ads have been popping up in droves on social media and the internet with familiar shopping adrenaline-triggering words: “Black Friday, Cyber Monday, Christmas.” Every brand has to take a unique approach with its digital ads to cut through the holiday madness.
As we get towards the end of 2021 and almost two years since the world has been living with Covid-19, across the aviation industry we’ve continued to talk about recovery in terms of air travel returning to pre-pandemic levels. Specifically, we tend to reference 2019, the last full year of air travel unaffected by this virus. With air travel growing year-on-year until then, 2019 is the high watermark in air travel, the year when global airline capacity and passenger numbers peaked.
As we approach the end of the year, we’ll be covering trends from 22 key markets. We’ll recap what each industry has experienced over the past year and what to watch for in 2022. Learn who are the top advertisers from each category and how they spend across formats. Quick service restaurants (QSR) found themselves in a unique position during the pandemic. 65% of Americans were cooking at home more often, rather than eating out. But despite the increase of home cooking, digital orders, home delivery service, and drive-through services climbed.
As shoppers are gleefully returning to stores this holiday season, where is the biggest divergence between online and offline growth rates? In today’s Insight Flash, we examine these differences across top holiday industries and subindustries, as well as in the US vs. UK. In both the US and the UK, total spend growth is outpacing online spend growth across the top holiday industries. In the US, one interesting trend has been in Department Stores, where online growth started strong at the beginning of November but has decelerated dramatically at the end of the month.
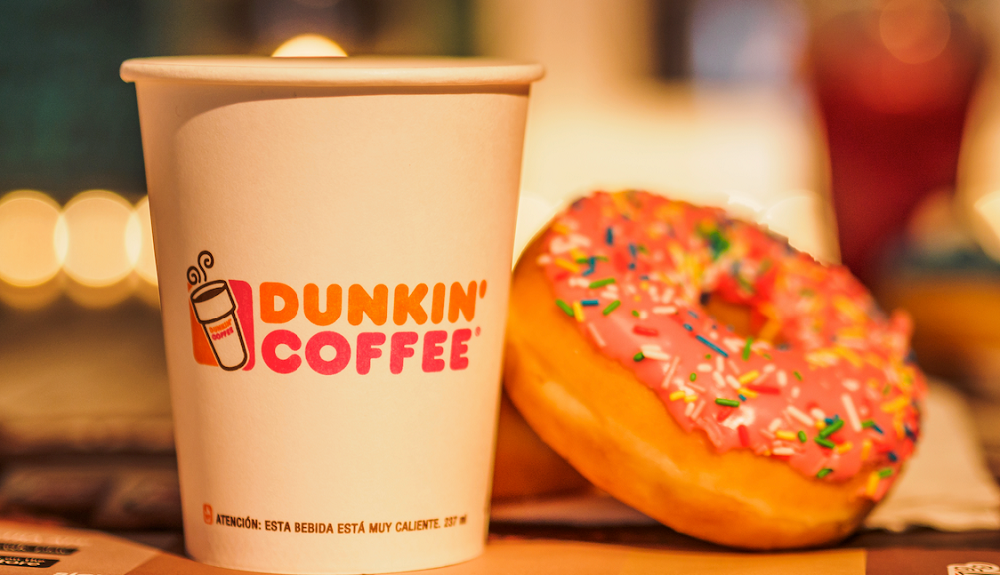
Apptopia CEO Jonathan Kay recently gave a keynote speech at Airship’s Elevate conference, showcasing the need for brands to invest into their mobile apps due to consumers' shifting behavioral patterns. The below is an excerpt from that presentation. To watch the whole presentation, scroll to the bottom of this post. The Dunkin’ mobile app has been growing engagement since August, when it was announced the app was available via Apple CarPlay. Apptopia’s X-Ray dataset indicates it is the only top 36 quick-service restaurant app in the United States with this integration.
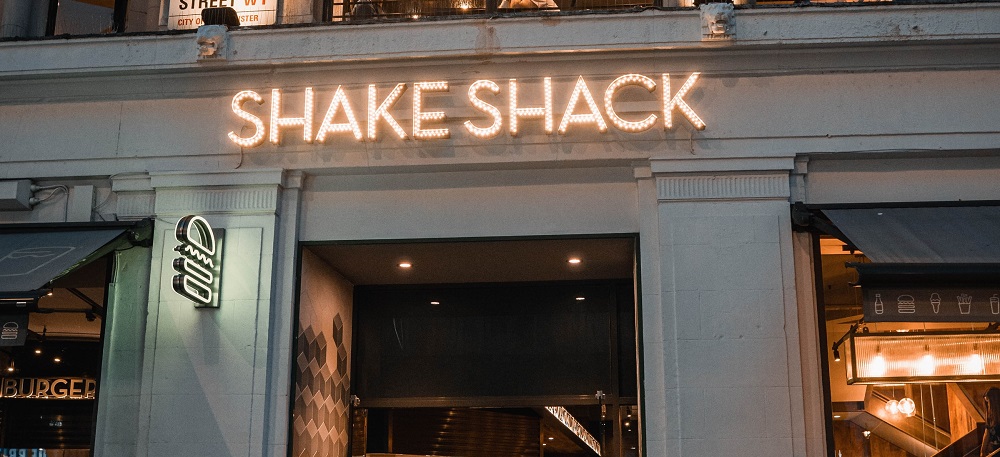
Throughout the COVID-19 pandemic, Shake Shack (NYSE: SHAK) has been revamping its omnichannel strategy. The fast casual burger chain has launched features such as curbside pickup and delivery through its own app to facilitate online ordering, and is looking to further expand its retail footprint in 2022 by opening drive-thrus and 50 new locations, primarily in suburban areas. Consumer transaction data shows that Shake Shack’s online sales as a percentage of total U.S. sales has been on the rise over the past two years.
The days before and after Thanksgiving are some of the busiest travel days of the year – so we took the opportunity to check back in and give an update on the travel and hospitality recovery as 2021 draws to a close. From April to July, the year-over-two-year (Yo2Y) monthly visit gap had been slowly but surely shrinking. But when we last checked in with the travel sector in late August, the summer season seemed to have ended abruptly, as the United States entered its fourth COVID wave.
As we approach the end of the year, we’ll be covering trends from 22 key markets. We’ll recap what each industry has experienced over the past year and what to watch for in 2022. Learn who are the top advertisers from each category and how they spend across formats. Home is where the heart is. And where you now spend most of your time. With so much time spent at home, Americans were more willing than ever to remodel their homes, invest in higher-end furniture and keep it clean.
The latest trend in the fashion industry is the rise of a handful of fast fashion brands targeted at Gen Z. Amongst these fast fashion companies, the one that has catapulted to cult status among young women across the globe is the Chinese retailer Shein, with a valuation of over $15 billion. Shein is one of the fastest – and most secretive – growing e-commerce companies in the world. Raking in close to $10 billion in 2020 (CB Insights), Shein has reportedly enjoyed eight consecutive years of over 100% revenue growth.
The Dodge Momentum Index fell 4% in November to 171.7 (2000=100) — down from the revised October reading of 178.1. The Momentum Index, issued by Dodge Construction Network, is a monthly measure of the initial report for nonresidential building projects in planning, which have been shown to lead construction spending for nonresidential buildings by a full year. In November, commercial planning fell 8% while institutional planning moved 5% higher.
National home prices increased 18% year over year in October 2021, according to the latest CoreLogic Home Price Index (HPI®) Report . The October 2021 HPI gain was up from the October 2020 gain of 7.4% and was the highest 12-month growth in the U.S. index since the series began in 1976. The increase in home prices was fueled by low mortgage rates, low for-sale supply and an influx in homebuying activity from investors. Projected increases in for-sale supply and moderation in demand as prices grow out of reach for some buyers could slow home price gains over the next 12 months.
The CoreLogic Home Price Insights report features an interactive view of our Home Price Index product with analysis through October 2021 and forecasts through October 2022. CoreLogic HPI™ is designed to provide an early indication of home price trends. The indexes are fully revised with each release and employ techniques to signal turning points sooner. CoreLogic HPI Forecasts™ (with a 30-year forecast horizon), project CoreLogic HPI levels for two tiers—Single-Family Combined (both Attached and Detached) and Single-Family Combined excluding distressed sales.
In May 2021, 1-in-5 purchase-home loan applications had an appraisal gap (meaning the estimated value in the appraisal is lower than the agreed upon contract price) that averaged 4.5% below buyer’s offer price. The frequency of an appraisal gap has since closed quickly after rising rapidly between January and May 2021. The decline in the appraisal gap occurred amid the fastest-rising annual home prices on record but weakening month-to-month price momentum.


