2020 was a great year for Xiaomi. As a starter, its solid online channels helped absorb the negative impact from Covid-19. Its new models (many featuring 5G at a steep discount vs. T1 players) outperformed the old ones which speaks volumes about the company’s strength in innovation. Furthermore, Xiaomi benefited from consumers shifting away from Huawei. Looking ahead, will Xiaomi continue its strength in 2021? How popular will the new models like Redmi K40 and Mi 11 Pro be?
Stripe has soared past SpaceX and pushed past Instacart to become the most valuable startup in the country. Earlier in the month, the company announced a new $600 million round of funding that included investors like Sequoia Capital, Fidelity Management, and Ireland’s National Treasury Management Agency and puts Stripes current valuation at $95 billion. For those keeping track, the figure has nearly tripled since Stripe’s previous valuation of $36 billion last year. With this most recent round of funding Stripe, which builds software that allows businesses to process payments online, has become the most valuable private company to come out of Silicon Valley–and it’s little wonder why.
Given the positive news of late and the broader trends around the pandemic, it’s tempting to start this post by noting that things seem to be slowly but surely starting to return to normal. But of course, that’s an entirely absurd notion. I’m not sure normal is still a thing. And in any event, the world is just about as bat-shit crazy as ever and the best that can be said is that maybe, just maybe, we’ve let up ever so slightly on the accelerator as we barrel down the highway toward the cliff of irreversible insanity. There’s a decent chance, in fact, that we drove off that cliff years ago and still have no idea.
Following the recent news that Ford is expected to halt production for two weeks in April due to chip shortages, and given our recent study on this exact subject few months back we wanted to take a closer look and quantify how the largest US carmakers and the industry as a whole is currently affected. Employee counts are often times the right metric produced by our foot traffic data to analyze industrial companies. Looking at the employee traffic at the US plants for the three major carmakers it is clear that we are consistently for the last seven or so months at subdued levels of production, with March being the first month showing al recovery.
Robust home price growth, which averaged 5.7% nationally over the last year according to the CoreLogic Home Price Index , drove equity of America’s homeowners with a mortgage up by more than $1.5 trillion. Added together across all homeowners in the U.S., home equity has grown more than $12 trillion since its low point during the Great Recession. This is good news for homeowners —but the situation is a little trickier when it comes to how that $12 trillion is spread, and which of those homeowners are currently in a stage of forbearance. For families who have a low amount of equity and are in forbearance, the risk of losing their home becomes higher.
Lululemon has been one of the most successful companies to translate pre-pandemic to post-pandemic prosperity. While some of this has been due to style trends favoring athleisure wear over business casual for work-from-home, the company has also made several successful strategic decisions to support this growth. In today’s Insight Flash, we leverage the online/offline channel breakouts available in CE Transact US and CE Transact UK transaction data, as well as the Men’s vs. Women’s product categorization available in CE Web, to better understand the drivers of this growth. In both the US and UK, Lululemon’s success has far outpaced the Footwear/Athletic Apparel subindustry.
On March 26, the co-working space company announced a definitive merger agreement with a special purpose acquisition company (SPAC), BowX Acquisition Corp. (NASDAQ: BOWX). Once the merger completes, WeWork will be a publicly listed company, and a must-follow for stock intelligence enthusiasts. It will also receive $1.3 billion of cash, “to fund its growth plans into the future.”
Cryptocurrencies had a monumental year. In December, Bitcoin (BTC) shot past $20 thousand, and at the time of writing, BTC is trading just below the $60 thousand level. This rapid ascent may bring déjà vu of 2017 when BTC climbed from $975 to $20,089. An analysis of the digital growth of U.K. cryptocurrency sites, along with worldwide events, indicates that financial services companies should keep a close eye on crypto this time. We’ll show you some tools to help.
As if Netflix’s latest documentary Seaspiracy wasn’t enough to make us really ponder the fate of our oceans, last week a huge shipping container was blown off course and became stranded in the Suez Canal. The 200,000-ton, 400-meter long (1,312-foot) ship blocked the infamous waterway for about a week before finally being freed from the shoreline. The Suez Canal accounts for approximately 30% of the world’s daily shipping container freight and is a critical link for trade between Europe and Asia. It’s estimated that the shutdown of the canal was holding up $9.6 billion each day, or $6.7 million a minute.
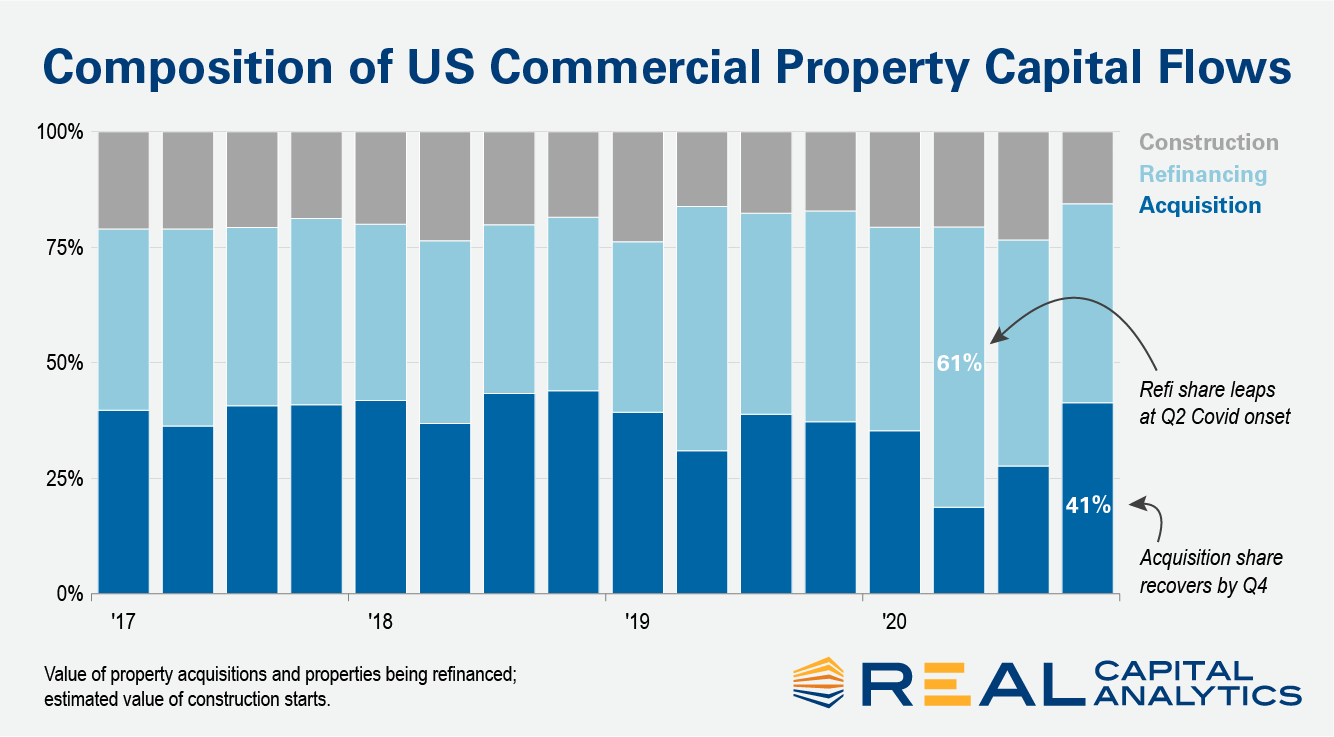
Deal volume contracted in 2020 due to economic uncertainty but did not result in a price collapse like that seen during the Global Financial Crisis (GFC). Capital flowing into other structures helped support pricing during this downturn. Into the second quarter as new acquisitions fell, financing activity picked up some of the slack in the capital stack. The value of properties refinanced represented 61% of all capital flows to commercial real estate in the quarter. This figure was well above the 19% share represented by new acquisitions.
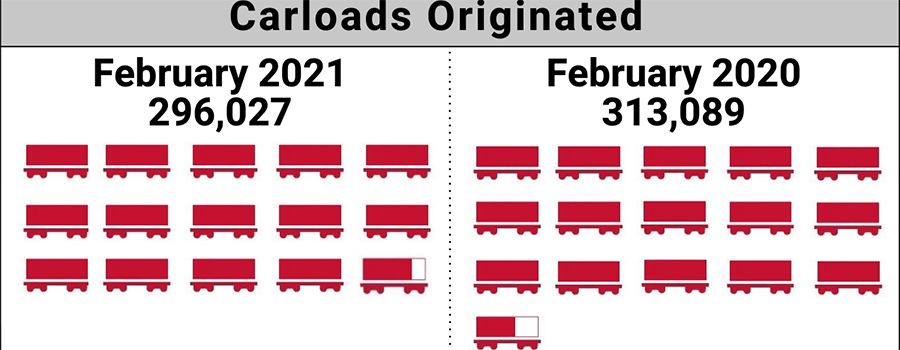
The number of carloads moved on short line and regional railroad in February 2021 was down compared to February 2020. Carloads originated decreased 5.4 percent, from 313,089 in February 2020 to 296,027 in February 2021. Coal led gains with a 42.3 percent increase. Grain was up 23.0 percent, and Trailer and Container increased 1.4 percent. Crushed Stone, Sand and Gravel led declines, down 42.5 percent. Chemicals, Food and Kindred Products, Metals and Products, Waste and Scrap Materials, Nonmetallic Minerals, Lumber and Wood Products, Metallic Ores, Pulp, Paper and Allied Products, Petroleum Products, Stone, Clay and Glass Products, Motor Vehicles and Equipment, Grain Mill Products and Other Carloads were also down in February.
Restaurants and bars in California have experienced a surge in visits over the last two months, with footfall reaching a post-pandemic high of 78% as the state’s vaccine roll out gathers pace.
The Association of American Railroads (AAR) today reported U.S. rail traffic for the week ending March 27, 2021. For this week, total U.S. weekly rail traffic was 521,731 carloads and intermodal units, up 16.1 percent compared with the same week last year. Total carloads for the week ending March 27 were 232,561 carloads, up 6 percent compared with the same week in 2020, while U.S. weekly intermodal volume was 289,170 containers and trailers, up 25.8 percent compared to 2020.
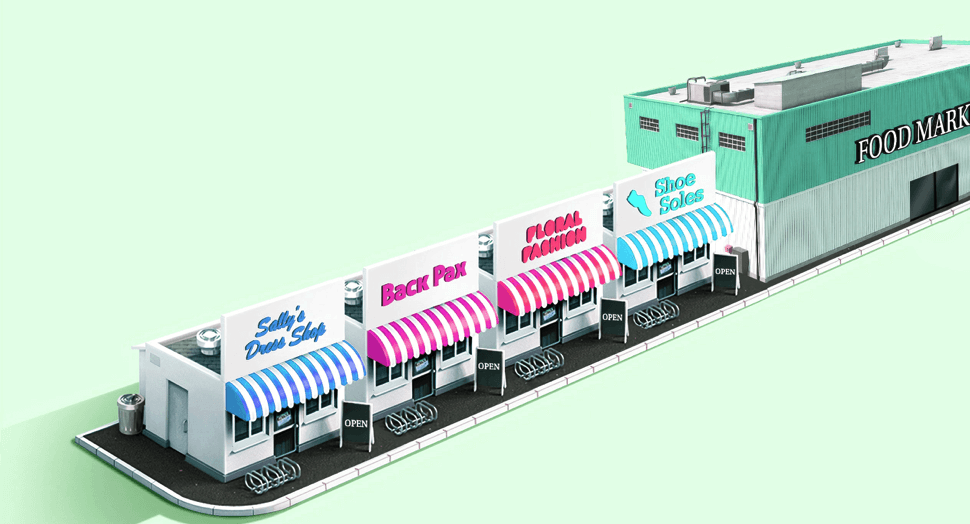
As a result of the pandemic, there has been a significant shift happening in major cities with many, if not most, seeing an exodus of residents. This has led some to speculate that the impact on city-oriented retail could be especially severe. Looking at net change in populations across some of the larger CBSAs in the country shows a clear pattern of decline. In January 2021, the New York CBSA saw a year-over-year difference of -1.2%, while San Francisco, Los Angeles, and Boston saw declines of 2.4%, 1.9%, and 1.7% respectively. While these drops are not massive, they are heavily offset by new residents making their way to fill gaps in these areas. And there are powerful indications that what is truly taking place is less about an exodus than a revival.
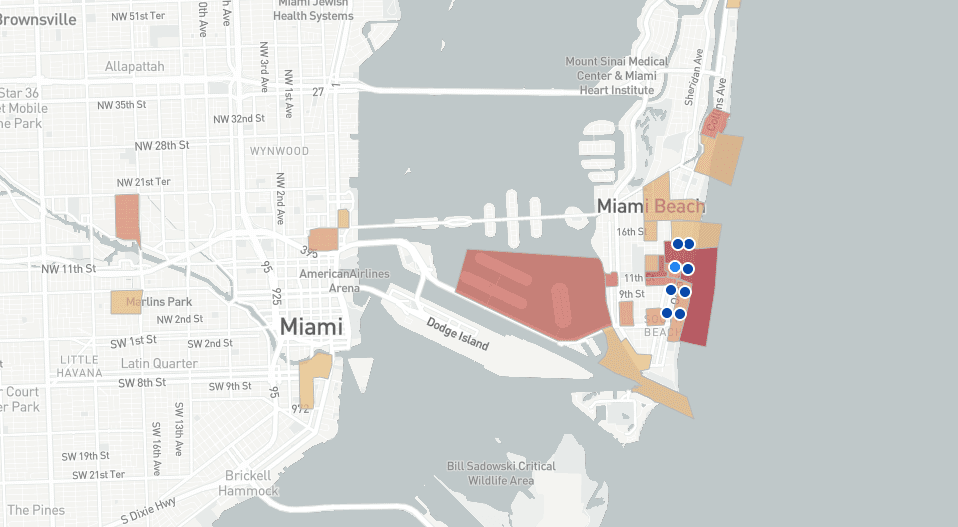
One year ago, the City of Miami Beach imposed a curfew to stop the spread of the Coronavirus. Fast forward to today, and City officials again imposed lockdowns at night – with Miami Beach City Manager Raul Aguila declaring a State of Emergency over building crowds in Miami Beach during Spring Break 2021. Visits increased to the Entertainment District over last year, yet largely moved in-tandem with last year’s trend. Yet by mid-March, visits to the Entertainment continued to surge far above last year’s count, with momentum, until a significant drop on March 21, a day after the Curfew order.
Estimates show that around 22.2 million jobs were lost during the pandemic. That said, the recent Labor Department reports have shown a resurgence in hiring, particularly in industries like retail and restaurants as businesses begin to re-open with easing lockdown measures. This influx of people looking for new jobs during the pandemic has sparked a greater need for virtual hiring and recruitment through mobile apps. As a result, the increased demand has brought about new platforms that have an all-in-one approach for hiring, with an emphasis on features such as video interviews. Traditional platforms such LinkedIn and Indeed are also seeing significant growth. Linkedin and Indeed saw 25% and 20% quarter-over-quarter global download growth in Q1 2021, respectively, to date (Mar 28, 2021). For example, our State of Mobile report found that LinkedIn ranked second for apps most likely to be used by Millennials in 2020.
This month’s data shows rent prices continuing to rebound in markets across the country. Our national index increased by 1.1 percent over the past month, the largest monthly increase ever in our estimates, going back to the beginning of 2017. The data continue to exhibit significant regional variation, but the days of plummeting rents in pricey coastal markets appear to be over. Although rents in San Francisco are still down 23.2 percent year-over-year, the city saw an increase of 3.4 percent this month, the biggest increase among the 100 largest cities in the country. 9 of the 10 cities with the sharpest year-over-year declines have now had two consecutive months of rising rents. At the other end of the spectrum, many of the mid-sized markets that have seen rents grow rapidly through the pandemic are showing that there’s still steam left in the current boom -- Boise rents also jumped by 3.4 percent this month, and are now up by 16.1 percent year-over-year.
Expectations for Chewy are high heading into the print on March 30. The eCommerce pure play beat consensus revenue estimates for the past six consecutive quarters. And in its last earnings report, the company issued strong guidance for the current quarter (November–January 2021). However, shares have pulled back recently on valuation concerns. Chewy is down 13% year-to-date following a massive build-up in 2020. Given the recent weakness in its stock over the past month, the key question now is: Will CHWY be able to beat revenue consensus estimates again and propel its stock price higher?
In this Placer Bytes, we dive into the recent recovery data from pharmacy leaders CVS and Walgreens and analyze their potential in the coming months. Visits to Walgreens, Rite Aid and CVS locations were trending in a very positive direction in late 2020. While the sector saw the same dip that other retailers did because of a resurgence of COVID cases, by December visits were again moving in a positive direction. CVS saw monthly visits down just 2.7% year over year, while Walgreens and Rite Aid were down 6.2% and 24.2% respectively – marking the lowest visit gap for Rite aid since the start of the pandemic.
In today’s Insight Flash, we take advantage of our newly launched UK channel data for industries and subindustries in our UK Brand Universe to examine how online shopping behavior has changed over the last year. With over 1,400 brands tagged for online and offline spend, it becomes clear that there are significant differences in industry share online versus offline as well as which industries and subindustries have seen the largest growth. Even from a high-level share perspective, major differences can be seen between how UK residents spent online versus offline in the last year.