Ask any Disney Plus subscriber and they'll tell you: the $7-a-month streaming service isn't just for kids. There's something for the whole family from Star Wars and The Mandalorian to Marvel, Pixar, National Geographic, and Disney classics like Snow White. And with everyone cooped up in the house, it's the perfect family-friendly, socially-distanced escape from reality. Let’s go behind the scenes with Pathmatics marketing intelligence to see how Disney promoted its streaming service in 2020. Everything from the brand’s strategy to its top channels and advertisements is outlined below.
Private companies go public for many reasons; to pay off debts, to provide exits for founders, to generate publicity or to fuel growth. Often companies on the verge of growth will increase their expenses, hiring employees to fuel that growth. LinkUp jobs data can provide a unique insight into the type of roles these companies are willing to spend money to fill.
Transits through British ports have climbed back to pre-Brexit levels and delays are showing signs of creeping down. Levels of traffic dropped by more than a quarter after the trade deal was struck and delays jumped by 15 per cent as port officials struggled with the new rules, according to Huq Industries high frequency index. But freight volumes have risen back to 94 per cent of normal levels before Covid-19 – roughly equal to their pre-Brexit levels – and they appear to be still rising.
A growing divide in credit quality and default risk for the US and UK retail sectors emerged in recent years. Since Credit Benchmark began tracking data on the retail sector, default risk has been higher for the UK than for the US, a trend that persists with the latest monthly update. In recent months the gap in default risk between US and UK retailers has been getting wider.
Home prices in the U.S. have been rising consistently for nearly 10 years, and the pace of home price growth quickened in 2020, leading to record levels of home equity. The latest CoreLogic Home Equity Report found that the average amount of equity per borrower was nearly $200,000 at the end of Q3 2020, a gain of $17,000 from a year earlier and over $100,000 from 10 years earlier.
January is well-known to be the biggest month for health and fitness app activity, so let's take the data out for a spin and see what we can determine. We'll start high level and then drill down into the performance of several Health & Fitness subcategories for the United States.
Expectations are high into the print after Etsy beat consensus revenue estimates over the past two quarters. Shares are now up over 300% (!) on a one-year basis. So will this hotshot eCommerce stock, beloved by Elon Musk, maintain momentum going forward?
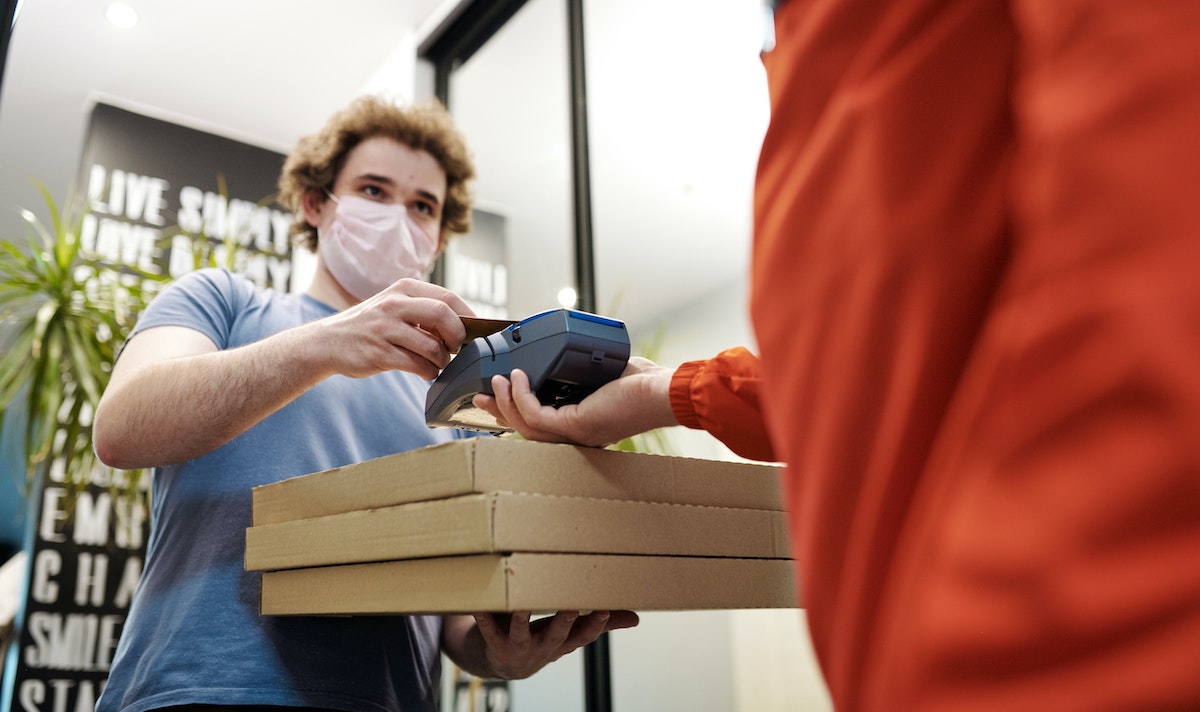
When many Americans sheltered in their homes early in the coronavirus pandemic, meal delivery sales reached new heights. Our data reveals that in January, sales for meal delivery services grew 164 percent year-over-year, collectively. Shelter-in-place orders may also be driving more Americans to make their first meal delivery purchase. In January, 46 percent of U.S. consumers had ever ordered from one of the services in our analysis, up from 36 percent a year ago.
When U.S. cities and states faced shelter-in-place orders to limit the spread of the coronavirus, Americans’ reduced mobility resulted in plummeting sales at rideshare companies. While rideshare sales have been gradually recovering over the past several months, November marked a decline for the first time since April. Sales rebounded slightly in January, but Uber sales were still down 67 percent year-over-year and Lyft sales were down 70 percent year-over-year.
Admittedly, we have high hopes for the gym sector and for Planet Fitness specifically. But there are reasons for the excitement and January data shows both why we are particularly optimistic, and why that optimism may be difficult to see upon initial glance. Looking at Planet Fitness monthly visits year over year paints a very clear, if not expected, picture. The brand kicked off 2020 with huge amounts of visit growth before quickly and obviously succumbing to the damaging effects of COVID.
In a former report, we used Measurable AI’s unique e-receipts data to look at the food delivery industry in APAC in the early months of covid-19, and saw a huge surge in food delivery volume. After six months, the pandemic is still not over, and so is the competition among the food delivery companies. Based on one year of historical data in 2020, Measurable AI presents the second part of the food delivery industry research, covering market share, user behavior, and pricing strategy.
When Uber first began trying to grow into smaller markets, some venture capitalists scoffed and didn’t think that its business model was scalable. Years later, the company has certainly proven naysayers wrong. The company has successfully expanded into business lines such as food delivery and just recently alcohol delivery with its purchase of Drizly. It has succeeded in expanding geographically as well, with operations in over 10,000 cities around the world. In parallel with Uber’s success at expansion, CE data has proven successful at capturing the company’s growth across both business lines and geographies.
In this report, ATTOM looked at 3,588 zones around the United States with sufficient sales data to analyze, meaning they had at least five home sales in the fourth quarter of 2020. The report found that median home prices increased from the fourth quarter of 2019 to the fourth quarter of 2020 in 77 percent of Opportunity Zones with sufficient data and rose by more than 10 percent in nearly two-thirds of them. Those percentages were roughly the same as in areas of the U.S. outside of Opportunity Zones.
Interest in mortgages skyrocketed in 2020 – a year defined by lockdowns and stay-at-home orders. Record-low interest rates in the U.S. and the real estate impact also likely helped boost demand. The result: Traffic to mortgage lender websites shot up by 71% from 2019 to 2020. The extraordinary rise in mortgage industry-related traffic outpaced the greater financial services industry, which climbed just 25% over the same time frame.
In this Placer Bytes, we dive into the performances of Home Depot and Lowe’s to see if two of the top retail performers during the COVID era continued their dominance into Q4 and early 2021. Since the onset of the pandemic, Home Depot and Lowe’s have been among the best retail performers. And late 2020 and January 2021 showed that this trend is still going strong.
Upon going public last week, America’s No. 2 dating app gained 63% on the day to close at an $8+ billion valuation. The company is trading on the Nasdaq stock exchange under the symbol “BMBL.” Bumble founder and CEO, Whitney Wolfe Herd, launched the app in 2014 with the intent of creating an online dating space that puts women in control. Bumble has since expanded beyond dating to friendship with their Bumble BFF service and professional networking with Bumble Bizz.
The year 2020 was a colossal year for many nations getting to grips with the virus that has closed international travel off for many, whilst airports sit empty and planes grounded on lonely tarmacs. However, throw in Brexit, the AstraZeneca vaccine, lockdowns, and travel restrictions, and the United Kingdom has been on a never-ending see-saw of ups and downs.
Total construction starts dropped 4% in January to a seasonally adjusted annual rate of $794.3 billion. Nonresidential building starts were flat in January, while nonbuilding starts dropped 10% and residential starts were 4% lower. From a regional perspective, starts were lower in three of the five regions – the Midwest, South Atlantic, and South Central. Starts rose, however, in the Northeast and West. With only one month of 2021 completed, a year-to-date analysis will provide little useful information.
January was encouraging for the restaurant industry. With same-store sales growth of -4.9% and traffic growth of -12.2%, it was the best performance for restaurants since the beginning of the pandemic almost a year ago. This is good news for an industry that struggled the last two months of 2020, as sales and traffic growth worsened compared to the COVID-era peak achieved in October. Likely contributing to some of the consumer pent up demand for restaurant spending was a combination stimulus check distribution, a sense of optimism from turning the page on 2020 and the increased prospect of additional government aid soon.
The mass migration from broadcast TV to on-demand – and from big-screen to mobile – started a decade ago. Lockdown moved it to a new level, with app-based video streaming up 40% in a year. According to our State of Mobile 2021 report, global mobile consumers streamed 146 billion hours on mobile devices in Q1 2019. By Q4 2020 they were streaming around 240 billion hours — a rise of nearly 65% in 2 years. The increase for 2020 alone was 40% to 935 billion hours.


