Citi Trends is a rising star in the off-price retail sector and has big plans for expansion and remodeling. We dove into the foot traffic data to analyze Citi Trends’ visit growth and see how the chain stacks up against other top retailers in the off-price space. Citi Trends owes much of its success to an aggressive expansion and remodeling strategy. According to CEO David Makuen, the remodels – dubbed CTx – highlight curated product assortments and enhance the customer experience. In 2021 the chain opened 27 new stores and remodeled 25 others.
After the hiatus of the past couple of years, OAG Megahubs is back! In a marked change from 2019, Megahubs 2022 demonstrates that, at least for the moment, US airports are the most internationally connected airports in the world. Thirteen of the Top 20 most internationally connected airports are in the USA with Chicago’s O’Hare International Airport (ORD) topping the table. On the busiest day in 2022, there were 43,350 possible international connections at ORD within a six-hour window. The airport has airline services to 66 international destinations and, combined with the extensive domestic network available at the airport, makes for a winning hub operation.
Spicy and numbing broth, smooth yet chewy rice noodles, affordable menu prices, and waitresses known as “TamJai Jeh Jeh” with distinctive accents… With all these features, TamJai noodle chains are rapidly taking over every district in Hong Kong. Tam Jai International (HKEX: 2217), which runs TamJai Yunnan Mixian (譚仔雲南米線) (“TamJai”) and TamJai SamGor Mixian (譚仔三哥米線) (“SamGor”), is now wholly owned by Japan’s largest restaurant operator Toridoll Holdings Corporation(TSE: 3397).Apart from serving Yunnan-style rice noodles in Hong Kong, Tam Jai International also expanded its restaurants in Mainland China, Singapore, and Japan.
Welcome to the October 2022 Apartment List National Rent Report. Our national index fell by 0.2 percent over the course of September, marking the first time this year that the national median rent has declined month-over-month. The timing of this slight dip in rents is consistent with a seasonal trend that was typical in pre-pandemic years. Assuming that trend continues, it is likely that rents will continue falling in the coming months as we enter the winter slow season for the rental market.
For this edition of STR’s U.S. “bubble” chart update, we returned the focus to revenue per available room (RevPAR), a core indicator of the general financial health of hotel markets. For the four weeks ending 10 September, there was an expected seasonal softening from the mid-summer travel peak. In fact, only six of the 165 STR-defined U.S. markets saw month-over-month RevPAR increases for the period, which included the Labor Day holiday. That holiday typically produces major decreases in industry demand—especially weekday business travel—as well as marks an informal end to summer travel.
Starbucks, the most prolific coffee chain in the country, recently unveiled a dramatic expansion plan. The chain hopes to not only add 2,000 stores to its nearly 16,000-strong fleet by 2025 but to also new implement new strategies in a bid to maximize sales and customer reach by embracing technology. We dove into the foot traffic data for the coffee giant to understand what lies behind this decision and whether the opportunity is really there.
The Basic Materials Industry includes Chemicals, Metals, Mining, Forestry and Paper. Output prices for these sectors have been very volatile in the past 12 months, reflecting recent rapid structural changes in the global economy. Metals for steel and alloy production – Aluminium, Iron Ore, Lead, Zinc, Manganese, Molybdenum and Tellurium are mainly down. Rare earths used in mobile phones, EVs, batteries, catalytic convertors, and flat screens – such as Rhodium, Titanium, Lithium, Palladium, Neodynium – are higher, with Lithium up over 200% YoY. Mined fuels such as Coal are up nearly 150% over the past 12 months in response to the Ukraine war.
As anticipated, U.S. hotel demand for the week of 11-17 September 2022 soared back, increasing 13% week on week (WoW) and pushing occupancy to a six-week high of 69.6%. Weekday (Monday-Wednesday) occupancy was slightly better at 69.9%, with the measure reaching 75.5% in the Top 25 Markets—the second highest level of the pandemic-era behind the week ending 18 June 2022. Nominal average daily rate (ADR) made its way to a seven-week high (US$156), up 5.8% WoW and +18% year on year.
Our latest white paper dives into retail media networks and explores several retailers on the cutting edge of this advertising revolution. Below is a taste of our findings. In spite of the gloomy predictions regarding the future of brick and mortar retail, major retailers are continuing to see their physical visits outnumber their online ones. Visits to Walmart and Target’s U.S. venues alone significantly outpace the brands’ global online reach, according to web data from Similarweb.
Back to school spending fell 8.6% YoY at key retailers* for the 8 weeks ended September 14, 2022. This is an improvement from the 10.0% YoY decline at the start of the season (four weeks ending August 17th) in states where class had begun. Most notably, spending was materially slower than the largely flat growth during the pre-pandemic 2019 season.
As at-home delivery services keep growing, Uber’s purchase of Drizly in October of last year seemed a natural synergy to complement Uber Eats and Postmates. But has Drizly been delivering? In today’s Insight Flash, we examine how Drizly’s direct business has fared over the last year since the purchase, looking at market share, average ticket, and cross-shop. Market share of spend directly through Drizly has declined since the Uber purchase. In the three months before the deal closed in 2021, Drizly had risen to \~3.5% share of spend for tagged brands in the Wine & Liquor subindustry.
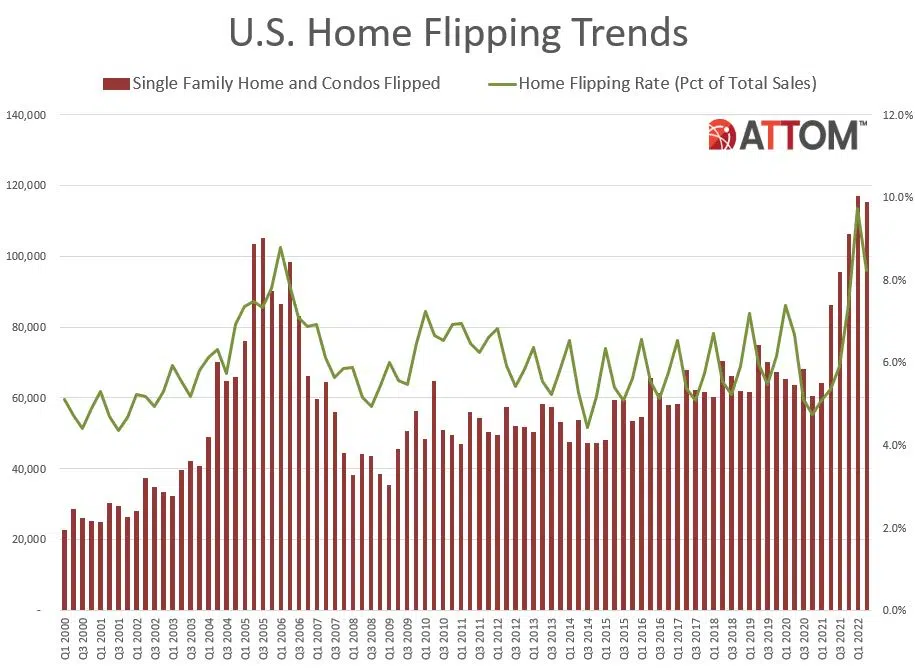
ATTOM, a leading curator of real estate data nationwide for land and property data, today released its second-quarter 2022 U.S. Home Flipping Report showing that 115,198 single-family houses and condominiums in the United States were flipped in the second quarter. Those transactions represented 8.2 percent of all home sales in the second quarter of 2022, or one in 12 transactions. The latest portion was down from 9.7 percent, or one in every 10 home sales, in the nation during the first quarter of 2022, but still up from 5.3 percent, or one in 19 sales, in the second quarter of last year.
Market concentration helps to indicate if only a few games (or publishers) dominate the majority of the market. This highlights competitiveness. Using Game IQ subgenres and breaking down by geography, we were able to highlight areas of opportunity and disruption to answer: Is the mobile gaming market dominated by only a few big players How can independent publishers break through the titans of the industry? Which regions are gamers most open to new entrants, new genres or new gaming mechanics?
The home improvement sector was one of the biggest retail winners of 2020 and 2021. But in the first half of 2022, inflation caused consumers to think twice about home improvement projects that could break the bank. We looked at six leading brands in the home improvement sector – Lowe’s Home Improvement, The Home Depot, Tractor Supply Co., Ace Hardware, Menards, and Sherwin-Williams Paint Store – to see if we could spot renewed foot traffic trends that could indicate broader consumer confidence and discretionary spending health.
The return of seasonal offerings like the pumpkin spice latte (or “PSL”)—which launched at Starbucks (NASDAQ: SBUX) this year on August 30—coincided with a noticeable uptick in weekly U.S. sales for the coffee chain. Looking at Starbucks’ sales volume during fall menu launches over the past four years, U.S. weekly sales were also highest during the launch in 2022.
The US labor market has changed over the last decade, and so have universities’ curricula and students’ major choices. But exactly how much has the college major landscape changed over the past decade? The indisputable new superstar of college majors is Computer Science. Enrollment in CS has increased by 140% over the past decade! The other majors that increased in popularity were also vocational in nature: Nursing, Business, and Engineering. All other majors have seen decreases in enrollment, with the biggest losses in Sociology, Literature, and History.
The Darden Restaurant Group is one of the world’s largest full-service restaurant groups. With eight restaurant chains in over 1,800 locations, the company owns and manages some of the biggest names in the dining industry. When we last looked at Darden, visits were starting to pick up following a tough year of pandemic restrictions. Now, as grocery costs are rising, we checked back in to see how these restaurants are being impacted by the current economic environment.
After a record run of 14 months of net improvements, this sample of more than 400 US Health Care companies has recorded three months with a CCI below 50, indicating that downgrades now outnumber upgrades. The changing balance between upgrades and downgrades in US Health Care is mirrored in Figure 2, showing that the long decline in average credit risk – measured by default probability (axis inverted) – has been faltering, with recent periods of credit deterioration.
Although U.S. single-family rent growth was up by 12.6% in July year over year, the gains continued to slow from the historic high recorded in April. CoreLogic observes similar price growth relaxation in most major metro areas tracked in the SFRI, including popular Sun Belt cities that have seen rental costs skyrocket. Miami’s 30.6% annual price gain again topped the country in July but is down from the 40.8% year-over-year growth recorded in March 2022. Phoenix, which posted a 12.2% annual gain in July, saw rental cost growth drop by 6 percentage points from March.
The top 10 quick-service restaurant apps in the U.S. were downloaded 10.3 million times in August, 14.8 percent less than those the month prior. Year-over-year in the month of August, downloads of the top 36 quick-service restaurant apps are up 18.9 percent. A download represents a new user and the first conversion on the mobile app customer’s journey. While the order has changed, every one of July’s 10 most downloaded quick-service restaurant apps have returned in August’s lineup. Dunkin’ moved up two spots from No. 9 to No. 7, very likely due to the release of its pumpkin spice flavored drinks and treats.


