The last decade significantly shifted the urban geography of the United States. The longest economic expansion on record brought new opportunities and challenges, then came to a screeching pandemic halt in 2020. The growth was long-lived but uneven. New and existing innovation hubs and oil towns boomed, while some markets struggled to shake off sluggishness after the Great Recession. Throughout the 2010s, America’s housing growth both reflected and reinforced these trends.
Gas prices and futures (contracts to buy gasoline at some point in the future) have been up massively over the last few months, to the extent that some traders are betting on the return of $100 oil/barrel before the end of the year (Options Traders Bet on Return of $100 Oil ). It was reasonable to expect that with US reopening after the pandemic we would see an increased demand in travel, and gasoline demand as a result.
As the COVID recovery progresses, our customers are eager to track changes in return to work across the country. This example shows how SafeGraph Patterns data was used to analyze how suburban, city, and downtown regions of Chicago have recovered since the pandemic commenced. Four major brands, Starbucks, Dunkin’, McDonald’s, and Subway, were selected as proxies for POI that workers would visit as they return to the office.
In this Placer Bytes, we dive into the recovery of Disney World and convenience stores to see if dropping COVID rates and returning routines drove a needed boost. When we last looked at Disney World, a compelling recovery story was beginning to unfold. While the recovery had been happening, albeit slowly, since the reopening of the park last summer, the spring gave visits a needed boost. Visits were down just 48.6% in March when compared to the equivalent month in 2019, but in April that gap had dropped significantly to just 32.4%.
Ad-supported streaming (AVOD) is a $11 billion business that doesn’t have a standard approach for ad purchasing. Confusing processes lead to slow revenue growth. Meanwhile, Hulu’s gross revenue continues climbing. Hulu is succeeding in the messy, crowded AVOD world and has much to teach. Which advertisers are buying from Hulu that could mean opportunity for you? Hulu has been the leader of the pack in ad-supported TV-streaming for years. And even though their market has become increasingly crowded
The Dodge Momentum Index moved 9.1% higher in May to 178.0 (2000=100), up from the revised April reading of 163.2. The Momentum Index, issued by Dodge Data & Analytics, is a monthly measure of the first (or initial) report for nonresidential building projects in planning, which have been shown to lead construction spending for nonresidential buildings by a full year.
Lumber prices have tripled since June 2020, adding an average of $24,000 to the price of a new US home; and reports from Canada show that timber poaching is increasing as a result. Sawmills were idle during the pandemic lockdown, so the usual inventory build over winter did not happen. These technical constraints on supply are colliding head on with a spike in demand as housebuilding restarts, with the added pressure of the post-COVID desire for larger houses.
Amazon Prime Day has officially announced Prime Day for June 21 and 22, 2021, and consumers are already gearing up for _Amazon’s_ biggest shopping day of the year. Digital commerce has increased immensely over the past year and is on track to surpass $11 trillion in sales in 2021 — _Amazon_ alone added 50 million Prime subscribers during the pandemic due to the closure of brick and mortar stores.
Below, ETR recaps the datasets on leading vendors in the Enterprise Apps, Data Warehousing, Productivity Apps, Marketing, and IT Services sectors. This article is based on ETR's Spring Technology Spending Intentions Survey (TSIS), which captures where IT budgets are being invested, citing participation from 1,500 IT decision-makers. Below are specific excerpts from each vendor's TSIS report, originally published on April 16th, 2021.
As anticipated, the Memorial Day weekend ushered in the highest occupancy the U.S. industry has seen since the start of the pandemic. For the week ending 29 May 2021, weekly occupancy reached 61.8%, the highest level since the final week of February 2020. On a total-room-inventory basis (TRI), which accounts for temporarily closed hotels, occupancy was 59.2%, which was also the highest since the pandemic’s start.
Transaction data reveals that travel-related sectors are recovering. As such, hotel sales spiked in April 2021 as increasing vaccination rates and warmer weather have more U.S. consumers planning vacations. The travel accommodations industry is reaping the benefits of the growing demand for travel, with Airbnb leading the pack. The hotel industry saw sales fall 77 percent year-over-year in April 2020, while Airbnb saw year-over-year sales decline 61 percent that same month.
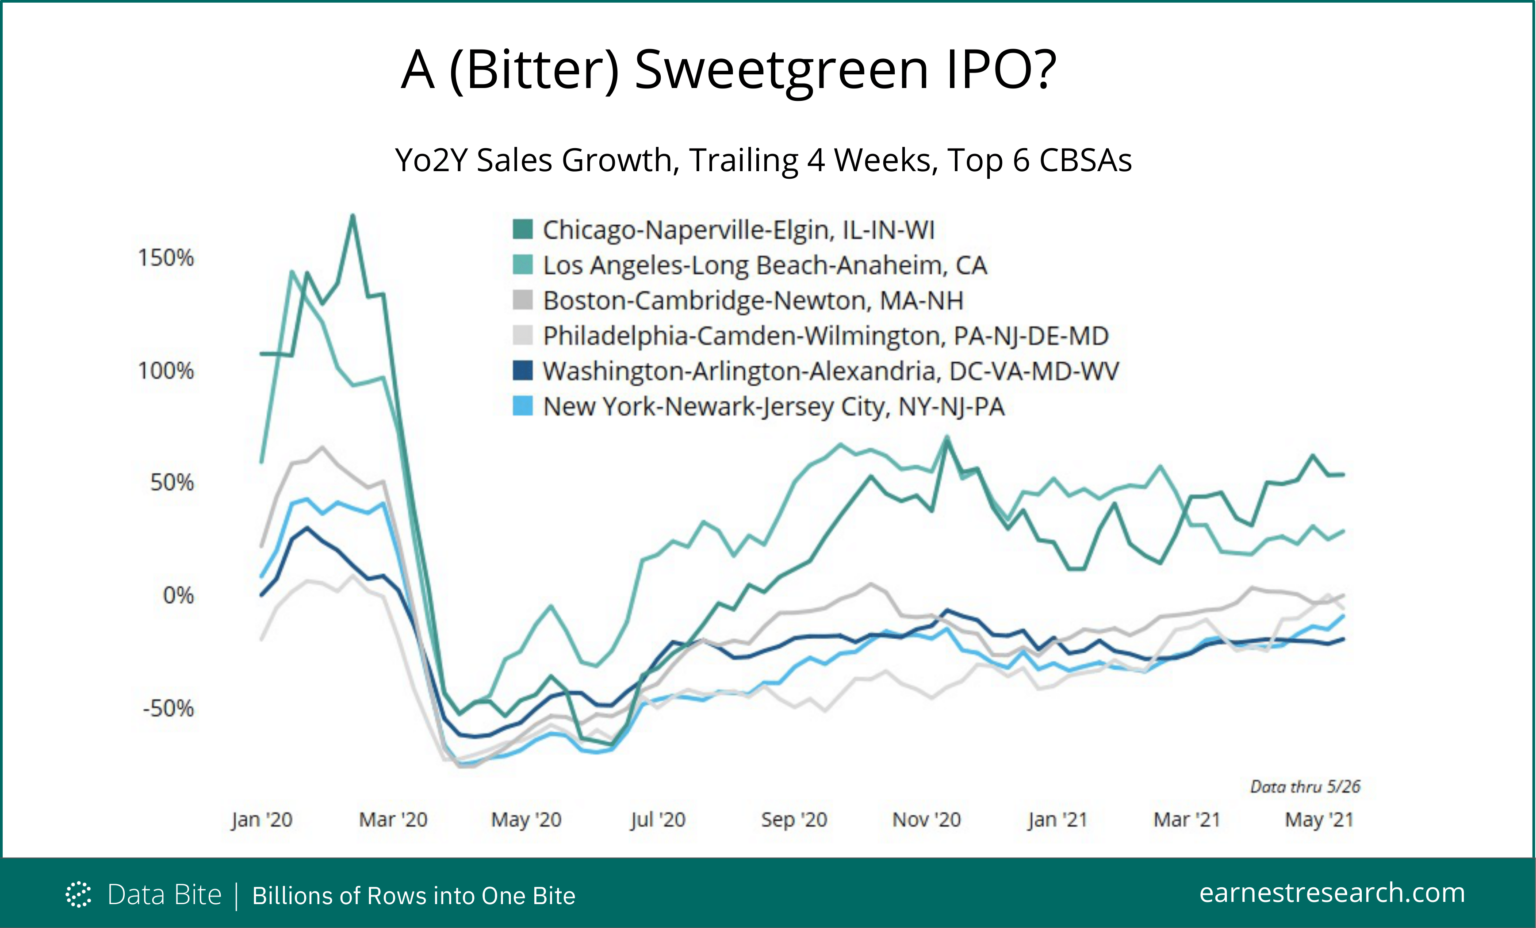
With reports that Sweetgreen is preparing to go public we looked at how the upscale salad chain has performed in its core urban markets. Regardless of pre-pandemic growth, all regions saw drops of 50% or more as offices closed and office lunches plummeted at the outbreak of COVID. Since then, Sweetgreen’s HQ market of Los Angeles rebounded the fastest, reaching >50% Yo2Y trailing 4 weeks in September last year, before tailing off to around 30% in recent weeks.
Increasing vaccination rates and loosening policies in regards to large gatherings and mask-wearing have re-ignited consumers’ interest in beauty products. One of the main beneficiaries of this phenomenon is Ulta Beauty, whose Q1 2021 earnings outperformed investors’ expectations. Consumer transaction data reveals that Ulta’s 2021 sales are surpassing historical performance, with sales in March and April 2021 exceeding same-month sales from the previous three years.
Cross-border commercial property investment by Chinese firms has been on the wane since China’s government implemented curbs on capital outflows in 2017, and there’s no indication that these capital controls are going to be lifted any time soon. The charts below show just how significant the impact on overseas investment has been. Between 2015 and 2017, mainland Chinese investors deployed just over $91 billion into income-producing commercial real estate globally.
While we knew the wider coffee sector was trending in the right direction, the latest numbers from top brands in the space only deepen the optimism. Additionally, the results also strengthen key findings from migration analysis data speaking to unique retail and hospitality opportunities in rising regions. Visits to top coffee and breakfast oriented chains have continued to improve in recent months when comparing visits to a ‘normal’ 2019.
ForwardKeys has long encouraged governments and tourism organisations to announce their border re-openings as far in advance as possible. We observed that this greatly benefited destinations such as Greece and Portugal for the 2020 summer season and there appears to be a case of _Deja Vu_ for Greece, but now we have newcomers to the early announcement club: Iceland and Croatia. Welcoming vaccinated travellers is not only a trend but a fast-growing reality.
As we start what we hope will be a return to normality, Fable Data asks: how permanent are these new patterns of consumer behaviour? How predictive is the data from the last year? Where do we see industry players holding onto their gains, and where do we anticipate a reversal to pre-pandemic positions? Food Delivery spend was already growing between 20%-30% YoY in the quarters prior to March 2020, when the first lockdown occurred.
Winter Storm Uri in February of this year ravaged much of the country, with the strongest impact in states with little snow experience such as Texas. But not all businesses were plowed under by the storm. Grocers actually saw a lift in sales in the days prior as snow-shy shoppers stocked up on essentials in anticipation of rough road conditions and grocery closures. In today’s Insight Flash we take advantage of our partnership with WeatherOptics and our newly launched WeatherOptics Signal dashboards to dig into which grocers were the most impacted
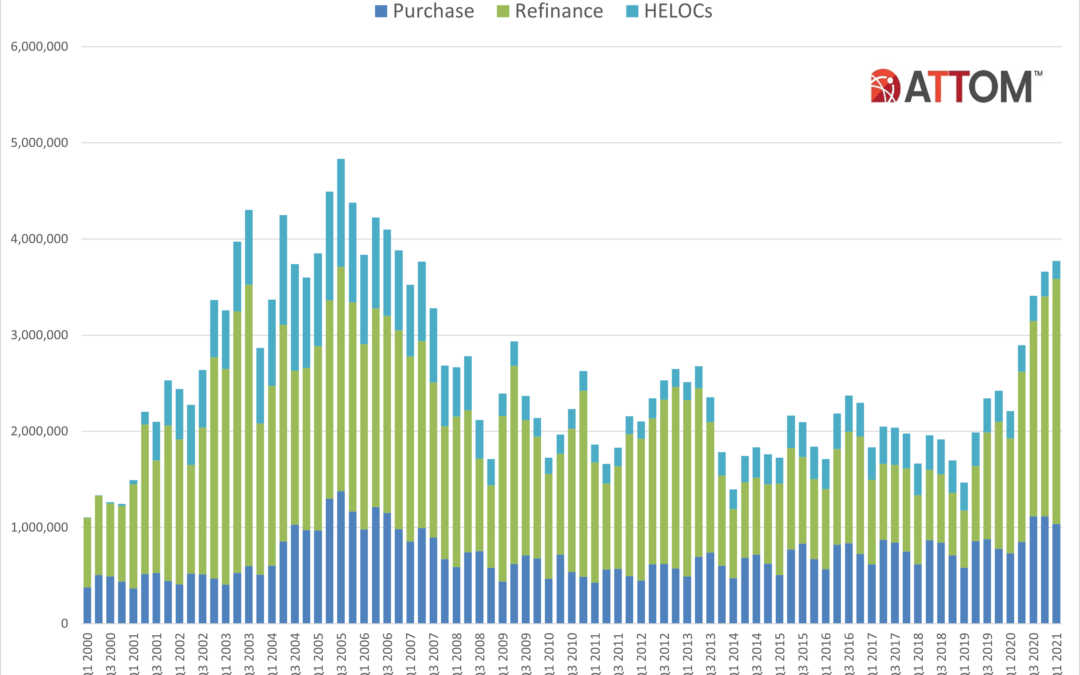
ATTOM Data Solutions, curator of the nation’s premier property database, today released its first-quarter 2021 U.S. Residential Property Mortgage Origination Report, which shows that 3.77 million mortgages secured by residential property (1 to 4 units) were originated in the first quarter of 2021 in the United States. That figure was up 3 percent from the previous quarter and 71 percent from the first quarter of 2020 – to the highest level in more than 14 years.
Doctoral degrees hold the promise of increased earnings, interesting research opportunities, and part/full time teaching positions. Some fields of PhD study have a long and storied history, like Chemistry and Physics, whereas other fields are new and rapidly growing, such as Machine Learning and Computer Science. One question we set out to answer was how PhD fields have changed over time, and if there are general patterns we can identify to predict changes in PhD field growth?