Whether it’s a strained pandemic relationship coming to an end or individuals looking for companionship after a long year alone, dating app usage and spend have increased significantly in the past year. Consumers spent over $3 billion on dating apps in 2020, up 15% YoY globally, seeing a total of 560 million dating app downloads. Going into Valentine’s Day, we can expect this trend to continue with the most popular dating apps encouraging users to put themselves out there.
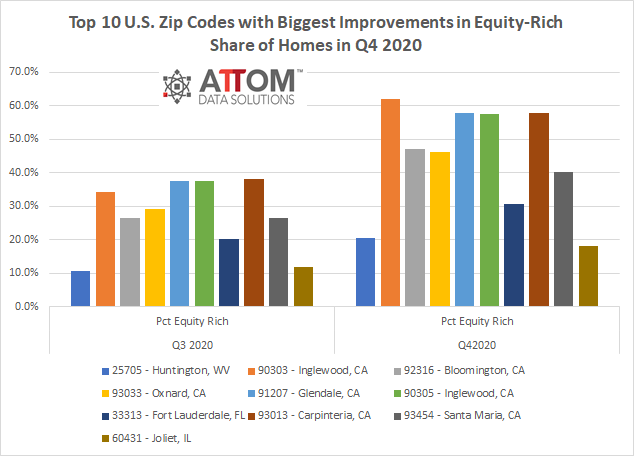
ATTOM Data Solutions’ new Q4 2020 U.S. Home Equity and Underwater Report shows there were 17.8 million residential properties in the U.S. considered equity-rich in the fourth quarter of 2020. According to the report, the combined estimated amount of loans secured by those properties was 50 percent or less of their estimated market value. ATTOM’s latest home equity and underwater analysis reported that the count of equity-rich properties in Q4 2020 represented 30.2 percent, or about one in three, of the 59 million mortgaged homes in the U.S. That figure was up from 28.3 percent in Q3 2020, 27.5 percent in Q2 2020 and 26.7 percent in Q4 2019.
After the lockdown last spring that forced manufacturers from all sectors to halt production, auto makers now have to face another challenge: the global chip shortage due to the high demand on consumer electronics (laptops, gaming consoles, TVs etc.). The increased need for the technology devices along with the initial lockdowns and employee furloughs overwhelmed chipmakers and now are struggling to keep up with the surge in orders.
In this Placer Bytes, we dive into the office supplies sector and the data from Macy’s outdoor concept – Market by Macy’s. While not quite as catchy as the Chicken Wars the battle for supremacy in office supplies warrants notice, especially with Office Depot recently rejecting a Staples acquisition offer. Looking at both brands, there is a clear narrative guiding the conversation around the sector – how can it survive?
The Big Game that almost never was - one of the final remnants of 2020 before we can truly look ahead to the new year...or, at least for football fans. A season filled with covid19 restrictions and protocols, multiple team outbreaks, and canceled games, many prognosticators thought we'd never get to the Super Bowl - but here we are! And although we won't see all the ads until the big game, several brands have already released their spots. And, in true 2020 fashion, some brands are doing things a little different this year.
Before we jump into our data for January, which is generally positive, there are some particular patterns related to how companies manage their job openings on their own company website that have a material impact on our data every January. It’s been a long time since I’ve seen anyone write about ADP’s Purge Effect where HR departments clean up their payroll systems at year-end and remove people that are no longer employed at the company because they left or were let go during the year, but the increase in activity around job openings in January is quite similar.
With Australia Day recently celebrated on January 26, the travel analytics experts at ForwardKeys decided to zoom into the latest air ticket data to see what is on the horizon for the sunny Land Down Under and the outlook reveals unique city opportunities. When examining the air tickets issued since the commencement of the Coronavirus in April 2020, domestic travel across Australia’s four main cities, revealed new destination gems in the mineral-rich parts of Australia: Queensland and Western Australia.
Consumer Edge data has been a strong predictor of H&M sales growth in both the US and the UK. But, the similarities between the markets may end there. In this week’s Insight Flash, we compare trends in both markets to assess differences in growth rates, which months are the most important to monitor trends, and brand performance. The US and the UK markets behave very differently, making it crucial to be able to track trends in both.
ATTOM Data Solutions, curator of the nation’s premier property database, today released its fourth-quarter 2020 U.S. Home Equity & Underwater Report, which shows that 17.8 million residential properties in the United States were considered equity-rich, meaning that the combined estimated amount of loans secured by those properties was 50 percent or less of their estimated market value.
The US version of Discovery Plus officially launched one month ago. Since then, the mobile app has been downloaded about 3.3 million times total across iOS and Google Play. Discovery+ labels itself as “the only streaming service with the greatest real-life entertainment from your favorite TV brands— including HGTV, Food Network, TLC, ID, Animal Planet, Discovery Channel.”
When they said all press is good press, they can use the recent Robinhood scandal as a case study. Looking at the digital traffic alone over the last 7 days, it’s clear that Robinhood is on fire. The online brokerage – and potential unicorn IPO – is at the epicenter of the surreal GameStop (GME) trading saga. It sparked outrage after banning, and then restricting, trades in so called meme stocks like GameStop, Nokia (NOK) and BlackBerry (BB).
In this Placer Bytes, we take a look at overall retail performance in 2020 and 2021 and dive into Southeastern’s Winn Dixie – even without their IPO. The wider retail sector had a memorable 2020 and while there were some categories that outperformed, it was certainly a challenging year for offline retail. While the wider retail segment saw visits up 3% and 4% respectively in January and February, the havoc of the pandemic made its presence felt in the spring.
The pandemic has touched all parts of society. But as new data from Huq Industries shows, the effect has been felt unevenly and particularly in respect of different socio-economic groups. We are all encouraged to stay at home where possible, and to limit our movements and social interactions. To that end, the chart below offers a measure of footfall into town and city centres across the UK, broken out by income group tercile.
Community group buying, an e-commerce model of group purchases by residents within the same neighborhood, is becoming increasingly popular since the second half of 2020. This industry sprang out in 2018, but got suppressed in 2019 due to poor regulations. However, after its re-entry into 2020 and the impact of COVID, on-demand grocery markets became the hottest topic again.
In this Placer Bytes we dove into the Q4 data surrounding the Yum! Brands’s portfolio, Chipotle and how 2021 has kicked off for these QSR leaders. Back when we checked in on Yum! Brands’s most popular chains, Taco Bell, KFC and Pizza Hut, monthly visits were still significantly down for all three brands, with Taco Bell showing the most severe year-over-year declines in traffic.
National home prices increased 9.2% year over year in December 2020, according to the latest CoreLogic Home Price Index (HPI®) Report. The December 2020 HPI gain was up from the December 2019 gain of 4% and was the highest year-over-year gain since February 2014. Price appreciation averaged 5.7% for full year 2020, up from the 2019 full year average of 3.8%. Home price growth in 2020 started off at a modest 4.3% rate in the first quarter, but as the pandemic limited supply throughout 2020, home price growth picked up, ending the year with an increase of 8.3% for the fourth quarter.
New research from Comscore (Nasdaq: SCOR), a trusted partner for planning, transacting and evaluating media across platforms, found digital payments usage in the United States increased as consumers turned to online food delivery services amid the COVID-19 pandemic.
After a dismal second quarter 2020, the national ad marketplace ended with a strong fourth quarter. SMI reported no category was stronger in the final quarter than Consumer Packaged Goods, with year-over-year ad spend growth of +34%, the most of any vertical. For calendar year 2020, CPG ad spend grew +10%, compared to -7% for the entire ad market.
To be clear, the stock price surges for GameStop and AMC had little, if not nothing, to do with their offline traffic, online traffic, or any other normal metric. However, they do provide a good opportunity to take a deeper look at two brands in flux.
As reported in today’s Financial Times, traffic through UK ports remains a quarter down on the levels seen pre-Brexit with delays up nearly a fifth. But levels associated with Brexit are muted in comparison to those seen during the first wave of the Covid-19 pandemic.