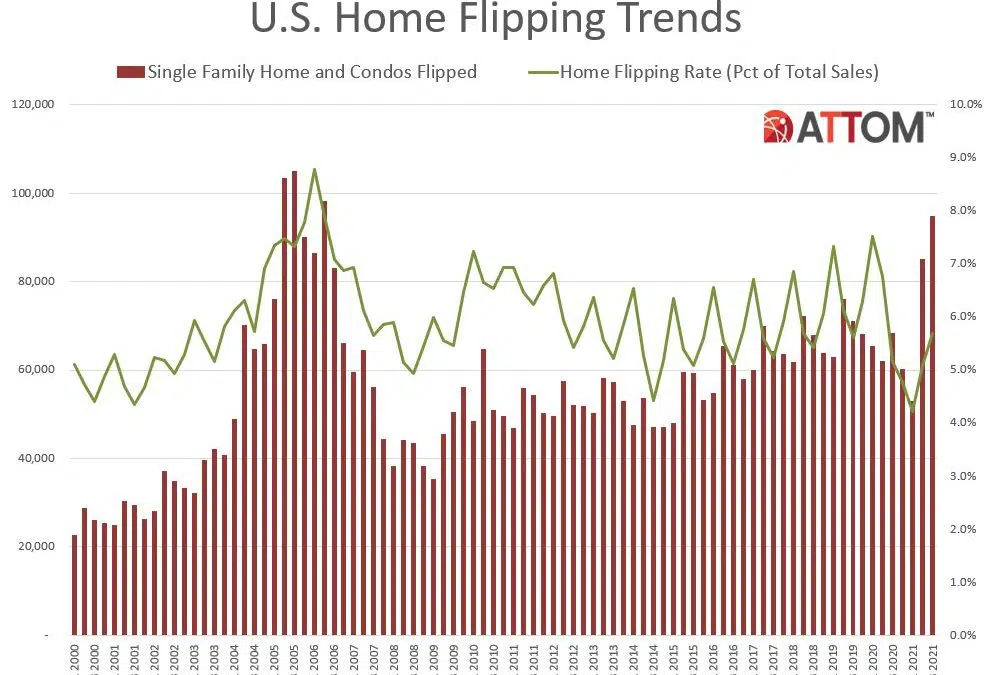
ATTOM, curator of the nation’s premier property database, today released its third-quarter 2021 U.S. Home Flipping Report showing that 94,766 single-family houses and condominiums in the United States were flipped in the third quarter. Those transactions represented 5.7 percent of all home sales in the third quarter of 2021, or one in 18 transactions, a figure that was up for the second quarter in a row after a year of declines.
In our last global P&L article, we noted that hotel profitability improved across much of the globe as the industry continued its slow recovery. In this latest update with October data, we saw similar trends in P&L data although there were notable outliers in each world region. Among the major European markets, Berlin achieved an October gross operating profit per available room (GOPPAR) of US$95.82, which was 111% of the 2019 comparable. Berlin was the only major market in Europe that was able to surpass its October 2019 GOPPAR level.
What’s your go-to messaging app? You may not know it, but your answer will largely depend on where you live. We analyzed Android data from 90 countries using Similarweb’s market research intelligence, to determine the most popular messaging apps across the world. We found that overall, there were three top messaging apps dominating the global market in 2021. Let’s dive right in.
The bipartisan Infrastructure Investment and Jobs Act will invest about $2 billion on cybersecurity, and support public and private entities as they respond to, and recover from, significant cyberattacks. Cybersecurity roles have been growing much faster than all other roles in the last decade. But with this renewed focus, can the government actually compete with the high salaries of the finance industry for the most sought after talent?
People tend to fight the last war. This truism applies to many aspects of life where people assess problems by interpreting them in light of previous bad experiences. The Covid-19 crisis and the resulting recovery in investment activity into 2021 makes a great case for never following this simple behavior. The Covid-19 crisis led to a flurry of fund announcements where investors planned to use the distressed investment playbook that worked so well after the Global Financial Crisis (GFC).
With 2021 coming to a close, and with apartment demand and rent growth rightly garnering a lion’s share of the attention, it is time to check in one last time this year on the new construction pipeline. Despite supply chain challenges and labor shortages, more new units were delivered through November of this year than in any recent complete year – and by a sizable margin. Nationally, about 325,000 new units were delivered through eleven months of 2021.
The pandemic has infused new life into brick and mortar retail. But retail’s potential will not actualize itself – retailers need to actively adapt their strategies and seize the opportunities presented by this unique moment in time. Our latest white paper examines eight key trends that emerged from the pandemic and that will continue to have a major impact on the retail sector going into 2022.
The Earnest First Choice Retailer Rankings are based on the credit and debit card spend of millions of de-identified U.S. consumers. Earnest identifies each shopper’s First Choice Retailer by comparing their spend across 1000 retailers between Thanksgiving and Cyber Monday. For example, if Shopper A spent $70 at Amazon, $50 at Walmart, and $30 at Target, their First Choice Retailer would be Amazon.
The CoreLogic Loan Performance Insights report features an interactive view of our mortgage performance analysis through September 2021. Measuring early-stage delinquency rates is important for analyzing the health of the mortgage market. To more comprehensively monitor mortgage performance, CoreLogic examines all stages of delinquency as well as transition rates that indicate the percent of mortgages moving from one stage of delinquency to the next.
In September 2021, 3.9% of home mortgages were in some stage of delinquency (30 days or more past due, including those in foreclosure), which was a 2.4-percentage point decrease from September 2020 according to the latest CoreLogic Loan Performance Insights Report. Comparatively, the overall delinquency rate in September 2019 was 3.8%. This is the closest the overall delinquency has been to the pre-pandemic rate since its onset.
It is easy to say that 2021 was the hottest real estate market ever. According to the S&P CoreLogic Case-Shiller Home Price Index (HPI), annual U.S. appreciation rates from April to September have been at their highest since the inception of the index. March through June produced the highest ever monthly appreciation rates, and CoreLogic’s public records data shows 2021 is easily on pace to be the first year where total residential housing transactions will exceed $2 trillion.
One of the areas where CE Receipt data can be a valuable tool is in analyzing the performance of Home Furnishings companies. It proved predictive of RH’s Total North America Revenue last week, as it has a wide demographic sample that fully captures all payment types and includes email receipts across a variety of inboxes including Gmail. Meanwhile, the gap between CE Transact data and company-reported growth has historically experienced volatility, including a sharper-than-reported deceleration in growth from Q2 to Q3.
The top five BNPL (buy now, pay later) app downloads hit 6.8M downloads this past November, a 54% increase over last November, while MAUs have grown 63% YoY. The top five apps are Klarna, Afterpay, Affirm, Zip and Sezzle. There are other smaller players too such as Spotii and Four. Klarna is clearly the largest player in the space, with its market share of new users holding steady. Earlier this year, we interviewed Klarna’s CMO (David Sandstrom) after the company ran a commercial during the Super Bowl.
Movie theaters are back in business. But the influence of streaming isn’t going anywhere anytime soon. During the pandemic in 2020, streaming service subscriptions passed one billion worldwide for the first time. Those habits are hard to kick. As you can see in the chart, streaming in 2021 exceeded that of 2020 and continues to rise. With so much more screen time, which of the 5 top Netflix shows took the crown for the most-searched series from 2021? Using Similarweb Research Intelligence, we conducted keyword research to find out.
The workplace recovery, which suffered a brief setback in September as the fourth COVID wave swept through the United States, is continuing apace. October visits were down by 47.7% Yo2Y, and the November visit gap shrunk even further to 34.3% – a major leap given that the Yo2Y visit gap had been hovering at around 50% for the previous four months. The fact that office foot traffic bounced back so quickly after this fourth COVID wave indicates that Americans are ready to return to their workplace.
Peloton is trying to eat Lululemon’s lunch, or protein-enhanced kale meal replacement smoothie, as the case may be. The high-end athletic apparel retailer filed suit against Peloton in late November, stating the fitness company’s designs for their new line of leggings and sports bras constitute patent infringement. Filed in the U.S. District Court for the Central District of California, the lawsuit finds Lululemon seeking an injunction against Peloton, in addition to a jury trial, damages and other monetary relief.
With data anomalies caused by reporting delays and behavioral changes over the holidays now in our rearview, Thanksgiving’s impact on the country’s health is coming into focus — and it doesn’t look great. Kinsa data shows overall levels of fevers were increasing before the holiday, then dipped dramatically beginning on November 24 as people spent time with family, traveled, and otherwise didn’t spend much time taking their temperatures. Since then, the number of fevers across the country has shot up well above pre-Thanksgiving levels.
Notable Hit 1: (THO:NYSE) On Wednesday December 8, 2021 Thor Industries, Inc. (THO) posted better-than-expected revenues of $3.96bn beating the consensus estimate of $3.48bn or by 13.8% and in the same direction as Advan's forecasted sales. The revenue was up 56% YoY - Advan's foot traffic data captured an increase in employee foot traffic of +39% YoY at its factories for Q3 2021. As a result of beating the sales and EPS, the stock opened at $107.92, up 1.4% from its previous day's closing price while hit a high of $110 (+3.4%) during the trading session.
In a somewhat typical post-Thanksgiving week (28 November-4 December), U.S. hotel occupancy rose from the previous week to 54.8%. Occupancy indexed to 2019 was 91, which was good but lower than the previous three weeks. However, when compared with 2010, a year like 2021 because of calendar make up and the rebuilding after the Great Recession, occupancy was 10% higher. This week’s average daily rate (ADR) surprised on the downside, falling 0.6% week on week. But with the gain in occupancy, weekly revenue per available room (RevPAR) increased by 3% from the prior week.
In order to make workforce comparisons, we need to create categories of similar jobs and skills. It’s useful to know that “Lawyer” & “Attorney” are similar job titles and “SQL” & “Databases” are similar skills so that we can better categorize them. But what about understanding which jobs or skills are the most different from each other? Presumably, there would be some compensation benefits to one's job or skill uniqueness?


