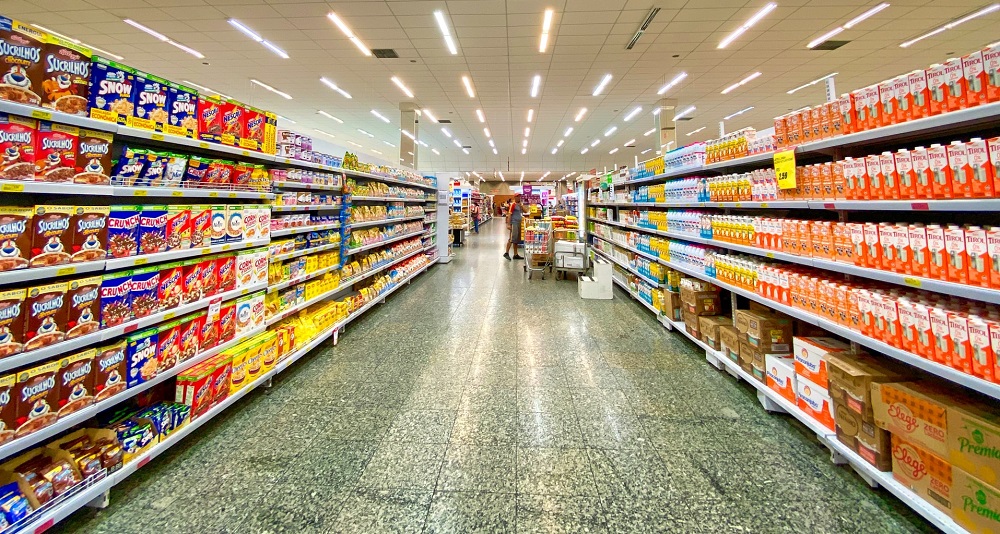
Albertsons Companies, Inc (NYSE: ACI), the parent company of supermarket chains such as Albertsons Markets, Safeway, and Acme, made its public debut back in June 2020. Alternative data—specifically, Bloomberg Second Measure’s consumer transaction data—shows that after an initial bump in sales at the beginning of the pandemic, Albertsons Companies’ sales are back to pre-pandemic levels. A closer look at our data also reveals that customer counts at Albertsons are lower than before the pandemic, but average monthly sales per customer is higher.
In late 2020, we discussed our belief that top tier malls would see a very strong recovery in 2021. The pace of the retail rebound was already seeing picking up, and several changes that mall owners had begun instituting years prior were well aligned with how the wider retail space was evolving. From new perspectives on tenant mix to a sharper focus on providing a wider and more holistic shopping experience, there were many reasons for optimism. And looking back at the performance of top malls in 2021 appears to justify that confidence.
Reddit is on track to join other publicly traded social media companies in its Wall Street debut. Famous for its message boards and network of niche communities, the San Francisco-based platform filed confidentially with the U.S. Securities and Exchange Commission (SEC) on Dec. 15, writing on its website that “the number of shares to be offered and the price range for the proposed offering have not yet been determined.” According to Reuter’s Sept. 13 report, Reddit hoped for a valuation of more than $15 billion.
Job postings are often used to measure demand in the economy. But does one job posting really represent one vacancy? And does a removed posting really represent a hire? Or, alternatively, are there roles where there is no posting but still a new hire? Or are there roles with postings but no talent to fill those roles? In short, what is the relationship of job postings to hires? By comparing job postings with new hires for the second half of 2021, we can see which roles have the biggest discrepancies between new hires and job openings. Below is their “hire to job posting” ratio:
The devil really is in the data this week, or to be more precise it is behind the data, but let’s start by looking at how 2021 finished. Global airline capacity ended at 5.7 billion seats compared to the 8.7 billion reported in 2019, so 35% below pre-Covid levels, and of course, demand is much lower for those 5.7 billion seats. Positively, the second half of 2021 saw a stronger recovery than the first half, and global domestic capacity was at 80% of 2019 levels thanks to markets such as China, the United States and Russia.
National home prices increased 18.1% year over year in November 2021, according to the latest CoreLogic Home Price Index (HPI®) Report . The November 2021 HPI gain was up from the November 2020 gain of 8.1% and was the highest 12-month growth in the U.S. index since the series began in 1976. The increase in home prices was fueled by low mortgage rates, low for-sale supply and an influx in homebuying activity from investors. Projected increases in for-sale supply and moderation in demand as prices grow out of reach for some buyers could slow home price gains over the next 12 months.
The CoreLogic Home Price Insights report features an interactive view of our Home Price Index product with analysis through November 2021 and forecasts through November 2022. CoreLogic HPI™ is designed to provide an early indication of home price trends. The indexes are fully revised with each release and employ techniques to signal turning points sooner. CoreLogic HPI Forecasts™ (with a 30-year forecast horizon), project CoreLogic HPI levels for two tiers—Single-Family Combined (both Attached and Detached) and Single-Family Combined excluding distressed sales.
Although “Black Friday Preview” deals from many retailers in early November pulled forward the holiday shopping season in 2021, the week before Christmas is still crucial for many retailers to pick up last-minute purchases. In today’s Insight Flash, we dig into how important this week was for online sales tracked by our CE Receipt data based on the percent of sales for the week, growth in items per transaction, and growth in price per item.
Each year, we kick off our content with a look at the retailers or retail segments we think could dominate the year to come. Last year, we explained why grocers like Publix and Albertsons would thrive, Planet Fitness would drive a major recovery, malls would rebound and a specific group of home improvement retailers would continue to impress. So who should you look out for in 2022? Here’s our list of the brands to watch.
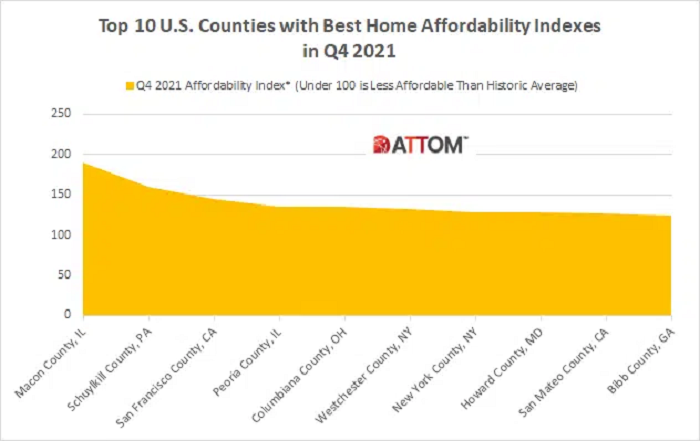
ATTOM’s just released Q4 2021 U.S. Home Affordability Report shows the latest pattern in home affordability – home prices still manageable, but getting less affordable – has resulted in major ownership costs on the typical home consuming 25.2 percent of the average national wage of $65,546. According to ATTOM’s latest home affordability analysis, the percent of wages needed to buy a median-priced single-family home is up from 24.4 percent in Q3 2021 and 21.5 percent in Q4 2020.
With the holiday season now closed and US Transact data available through December 24, we look back on December holiday spend to examine key trends by region, subindustry, and channel. US NAICS Retail spend was up double digits year-over-year across all census divisions for the pre-Christmas December shopping period. The strongest growth was in the East South Central and Middle Atlantic divisions at 17.2% and 16.7%, respectively. The West North Central and West South Central divisions had the weakest growth, still at 11.2% each.
How did people get anywhere before Google Maps? The GPS app leads all travel apps for most new installs in the year 2021. Below you can see the 10 most downloaded travel mobile apps and OTA (online travel agency) apps across the world and in the US. You can find our full list of 2021 worldwide download leaders here, and compare them with 2020's most downloaded apps. If you need to fully understand what a download is and what is does/does not measure, we have that for you as well.
Congratulations, if you're reading this it means you have made it through the year! 2021 is over and as our gift to you, Apptopia has our annual download leader charts ready to go. Below are 30 top charts across a plethora of high interest industries. All data is iOS + Google Play combined, except for data from China which is iOS only. If an app has a "lite" version, that data is included in the respective app's data. We created these categories ourselves and had to make decisions on distinctions. In general, we tried to group apps with the same primary function together.
Despite chip shortages and factory closures, top consumer electronic producers had strong sales this year. According to the latest report by Global Market Insights Inc., the market valuation of consumer electronics will cross $1.5 trillion by 2027. Trends that will mark this sector next year include: a push for smart devices, more energy-efficient products, and investment in other sustainability practices. With the steady growth in the electronics market, it’s a great time to pitch top brands who invest heavily in advertising.
As the food delivery industry continues to grow with record high order volumes in different markets every day, it’s like a roller coaster that only goes up. On this roller coaster, the ultimate goal for all the food delivery companies right now is to compete for market share. Asia has grown to be a major battlefield for the biggest food tech companies in the world. As 2021 draws to an end, Measurable AI presents the third part of this food delivery industry research in Asia, covering specifically market share and average order value.
Apple is reported to break iPhone sales this holiday season selling over 40 million devices from Black Friday to Christmas. As consumers unwrapped new iPhones and Android phones on Christmas morning, they downloaded a flurry of apps and games, activated new subscriptions and bought new in-app purchases to uplevel their gameplay, access new lives and upgrade their avatars' skins.
In-person dining at national restaurants began returning to pre-pandemic levels once people received their vaccinations. According to the NPD Group, online and physical visits to fast casual restaurants were up 8% year-over-year by August, reaching levels similar to 2019. “Fast casual restaurants have capitalized on the lessons they learned during the pandemic,” says David Portalatin, NPD food industry advisor and author of Eating Patterns in America.
Public equity investors use Apptopia's app data estimates to identify leading indicators and trend shifts in tickers six to eight weeks ahead of consensus. Apptopia's data is quite literally a clairvoyance in equity trading (we won't haunt your house though). Apptopia's Director of Equity Research, Tom Grant, recently chatted with Neudata to discuss travel industry trends as COVID-19 continues to shape the sector. Car rental companies, like everyone else in the industry, have taken a hit from COVID.
In our recent collaboration with Bloomberg News, we tracked real changes in salaries through 2021 using CPI adjustments by MSA and occupation. We found that Recruiters had the biggest increase in real salaries by a large margin. Below are the highest and lowest real changes in salaries by occupation in 2021: Our recent work for Recruiter.com provided a deeper dive into the market for hiring Recruiters in 2021. By tracking the headcount of recruiters at more than 12,000 public companies, we found that growth of Recruiter roles has outpaced other roles in 2021.
In this Placer Bytes, we dive into two ends of the affordability spectrum by looking at McDonald’s recent foot traffic data and analyzing the recovery of leading luxury retailers. For McDonald’s, like for the rest of the dining sector, this year started off difficult in terms of in-location visits. But the fast-food leader saw its traffic increase significantly in July 2021, and visits have stayed in line with 2019 levels ever since.


