Roaming might seem like an unusual topic in a time when inter-country travel has been largely prohibited, but we wanted to build on our previous analysis to see how roaming performance and behaviors evolved over the past year. This analysis examines Speedtest data from Android devices in the European Union (E.U.) and the United Kingdom (U.K.) from Q1 2020 through Q1 2021. We’ve included the U.K. to maintain continuity with pre-Brexit reports.
Just like other industries, the energy sector is experiencing supply chain bottlenecks. Most of the attention is on the clean energy sector. The sector experienced tremendous growth last year—but faces challenges like cost-inefficiencies, fragmentation, and a lack of mature industrial partnerships. As you and your sales reps enter advertising conversations with energy sector brands, it’ll be essential to know what’s going on in their world and what the most recent spending patterns have been.
The number of transits through post-Brexit ports is up to 25pts greater than they were pre-Brexit and before the pandemic, with high-frequency mobility data supporting evidence of growing UK international trade. This original measure has been created using Huq Industries’ proprietary, first-party data, and is made available at just 48hrs behind real-time. The output shows that since the start of the 2021, transits through UK ports of entry have consistently surpassed levels observed at any time in the past 18 months
Total construction starts dropped 1% in May to a seasonally adjusted annual rate of $902.8 billion, according to Dodge Data & Analytics. The brunt of the decline was borne by residential starts, while nonresidential and nonbuilding starts continued their recovery from the COVID-19 pandemic. “The weight of higher material prices and a lack of skilled labor are having a direct and notable influence on residential construction activity,” said Richard Branch, Chief Economist for Dodge Data & Analytics.
Knowing you might not have time to watch our full webinars, we are pleased to continue our series of COVID-19 webinar summaries. In this latest edition, we talk performance and signs of in Europe. While Europe prepares for the summer months, hotel performance levels remain low. The U.K. is the outlier most recently, however, with a 59.5% occupancy level on a rolling 7-day average ending with 6 June. That performance came as pent-up demand during reopening met additional demand for the half-term school holiday.
When many Americans sheltered in their homes early in the coronavirus pandemic, meal delivery sales reached new heights. Our data reveals that in May 2021, sales for meal delivery services grew 17 percent year-over-year, collectively. Shelter-in-place orders may also be driving more Americans to make their first meal delivery purchase. In May 2021, 48 percent of U.S. consumers had ever ordered from one of the services in our analysis, up from 41 percent a year ago.
When the infamous ‘Chicken Wars’ first kicked off the summer of 2019, it laid the foundation for one of the most incredible stories of brand lift in the QSR space – catapulting Popeyes to newfound heights. But as interesting as the initial surge was, the subsequent October bump and the wider effect it had of driving more players into the Chicken Sandwich mix may have been even more meaningful. The result was a scenario that intertwined chicken and QSR success. So where do things stand at the moment? We dove into QSR’s chicken-sandwich leaders to find out.
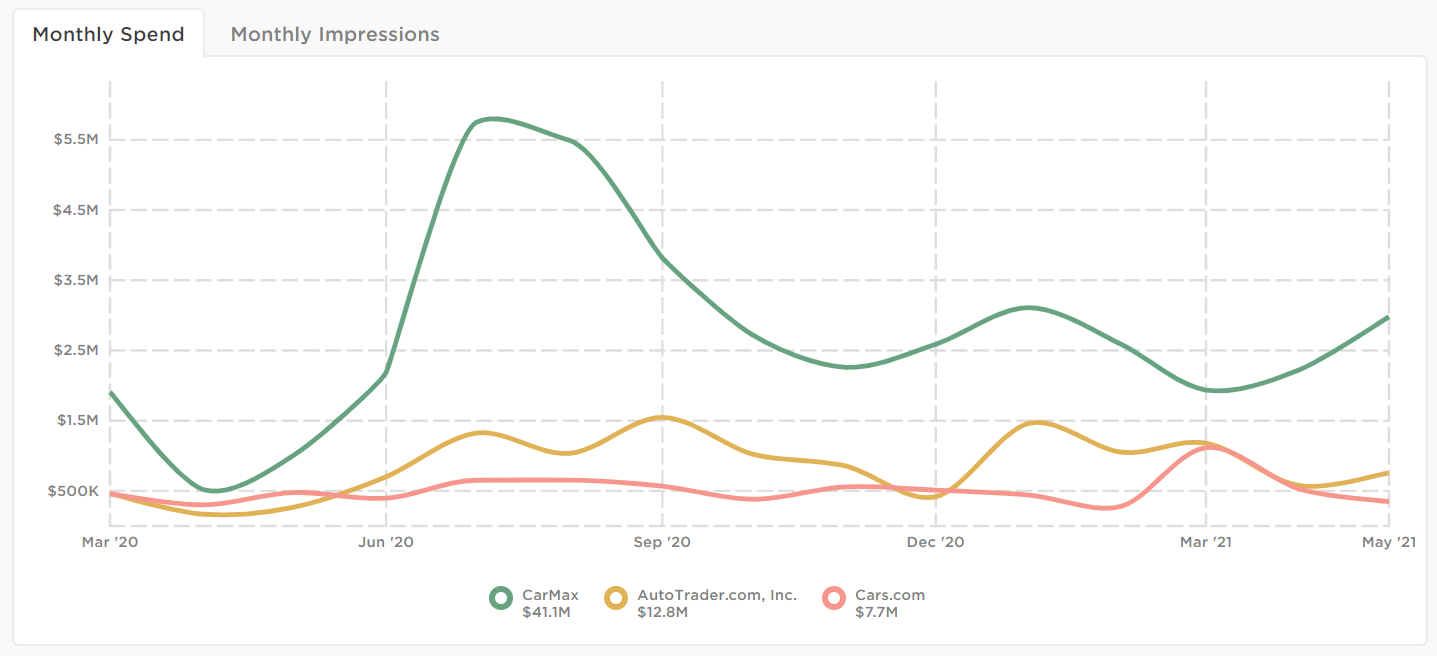
With so many people skipping their commutes and staying at home, you might expect car sales to have taken a hit during the pandemic. But according to Edmunds.com, COVID-19 has only accelerated the demand for used cars. August and September 2020 posted the fastest rate of used car inventory turnover in the last six years. Part of this has to do with the shortage of new vehicles due to auto factory shutdowns. With fewer options to buy new, cooped-up consumers have been setting their sights on used cars.
U.S. single-family rent growth increased 5.3% in April 2021, the fastest increase since May 2006, according to the CoreLogic Single-Family Rent Index (SFRI). The index slowed in 2020, but even when compared with 2019, rent growth is running above pre-pandemic levels. The index measures rent changes among single-family rental homes, including condominiums, using a repeat-rent analysis to measure the same rental properties over time.
With mortgage rates declining to ever new lows during 2020, the mortgage market had the largest number of originations in 17 years. The volume was driven by no-cash-out refinance: more than one-half of the originations, and 4-in-5 refinance loans, were no-cash-out during 2020. Interest rates on fixed-rate mortgages were at an all-time low at the beginning of 2021 and have moved higher since then. While forecasts vary, the consensus view among economists is that mortgage rates will rise between one-fourth to three-fourths of a percentage point during the next 12 months.
ATTOM, licensor of the nation’s most comprehensive foreclosure data and parent company to RealtyTrac (www.realtytrac.com), the largest online marketplace for foreclosure and distressed properties, released its May 2021 U.S. Foreclosure Market Report, which shows there were a total of 10,821 U.S. properties with foreclosure filings — default notices, scheduled auctions or bank repossessions — down 8 percent from a month ago but up 23 percent from a year ago. Foreclosure starts, which represent the initial notice of default, grew by 36 percent year-over-year.
Mobile gaming is driving the entire global gaming market with consumer spend set to surpass $204 billion in 2021 across mobile, console, handheld and PC/Mac gaming. Top grossing games like _ROBLOX_ and _Genshin Impact_ feature cross-play features demonstrating that cross-platform connectivity and the ability to share progress and play across different platforms are not just novelties, they may prove essential for long term growth.
2021 for the multifamily industry has been partially characterized by a very active new construction pipeline and a robust rebound in apartment demand. In ALN newsletters and blog posts these developments have been touched upon from various angles including price class, market size, and evaluation of specific markets. One area that has yet to be addressed is how all of the action of 2021 has played out across the urban-suburban-outlying area divide.
While occupancy across Brazil is taking time to recover, resorts have seen considerable upward movement with leisure demand growing robustly in the country and travelers seeking not just a getaway, but a full-blown experience. Before jumping into the metrics for resorts, let’s note a few occupancy milestones for context. Brazil reported its lowest pandemic occupancy level in April 2020 at 10.7% . Ten months later during January 2021, Brazil saw its highest pandemic occupancy level at 36.0%, driven by domestic demand at beach destinations around the New Year’s holiday.
Earlier this month (June 2), Amazon announced that its annual Prime Day will take place June 21 – 22. Prime Day 2021 will feature over 2 million deals worldwide, the most ever offered in the event’s seven-year history! Although the impact of the pandemic makes it particularly difficult for brands to develop 2021 strategies, we’ll use Similarweb Shopper Intelligence to make actionable, Amazon Prime Day predictions by comparing this year with last and describing top consumer trends we foresee impacting this year’s shopping event.
If there’s one sector that saw a pandemic driven boost, it was the home improvement space. Home Depot saw a year-over-year visit increase of 13.1% between 2019 and 2020, while Lowe’s and Tractor Supply saw respective jumps of 21.3% and 18.5%. The success carried into 2021, with visit surges driving huge year-over-year growth in the first quarter. The rise of work from home, the added time at home during closures, and shifting migration patterns all contributed to the sector’s unique success.
The TV and streaming market is constantly being redefined. The player moving quickest these days is AT&T, owner of HBO Max. AT&T’s been working towards a merger between WarnerMedia and Discovery to create a new $150 billion content unit, Warner Bros. Discovery. And it launched HBO Max’s ad-supported tier earlier this month. This is all against the backdrop of increasing competition among streaming platforms. We’re not referring to the number of players in the market—those days are gone.
Central Manchester is the busiest it’s been since the start of the pandemic, with footfall levels more than double what they were in January 2020 as the city grapples with a surge in new Delta-variant cases. This high-frequency data, made available at just 48hrs behind real-time, is a proprietary output from Huq Industries, the leading provider of footfall, mobility, store visit and real economy data to professionals in finance, government, retail and real-estate.
Although Grocery has been one of the slowest industries to move online, Meal Kit companies have carved out a niche in both the US and UK by taking the planning out of meal prep. In today’s Insight Flash, we examine the growth trajectories across the two continents, focusing on overall spend growth, order size growth, and how the market leaders have changed. Meal Kit growth in the UK has outpaced growth in the US over the last year and a half, with May 2021 spend 2.6x that of January 2020.
Usage of London’s transport network – which includes TFL’s tubes and buses – and overland commuter services has regained 60% of pre-pandemic levels as the country eases out of restrictions implemented during the last six months. London has lagged the UK across multiple measures since the crisis began in March 2020, and with so much invested across the capital, businesses are eager for the signs of recovery that this research provides.