As the global COVID-19 pandemic took hold in the United States in early 2020, both grocery and food delivery services saw huge increases in business. Several online grocery purchase platforms saw a 6x increase in new customers making their first-ever purchase during the week of March 31. States like Florida, Georgia, North Carolina, Illinois and Pennsylvania saw particularly high growth in consumers opting to have their groceries delivered for the first time. Throughout the summer of 2020, food delivery services remained popular and spending continued to remain more than 100% above 2019 levels.
While the change in migration during COVID was not as dramatic as some expected, even small shifts in migration patterns could have major implications for strategic business decisions. The way Americans move can impact the way retailers reach their audiences, which office space strategies top employers must utilize, and how cities and regions drive key tax revenue. State-level migration data shows that the population change that most states experienced between January 2021 and the previous January did not exceed 1%. This limited net change shows the ‘stickiness’ of a home area, which is heavily influenced by work, family, schools, the cost of living, and more.
The average mobile consumer has an increased number of apps downloaded on their mobile device. In H2 2020, the average consumer had 110 apps installed, an increase from 87 apps during the same period 2 years ago. The pandemic accelerated this behavioral change hitting a peak in hours spent during H1 of 2020 (when lockdowns were at their peak). Time spent in apps remains high even as many consumers are now able to venture out in a post-lockdown period.
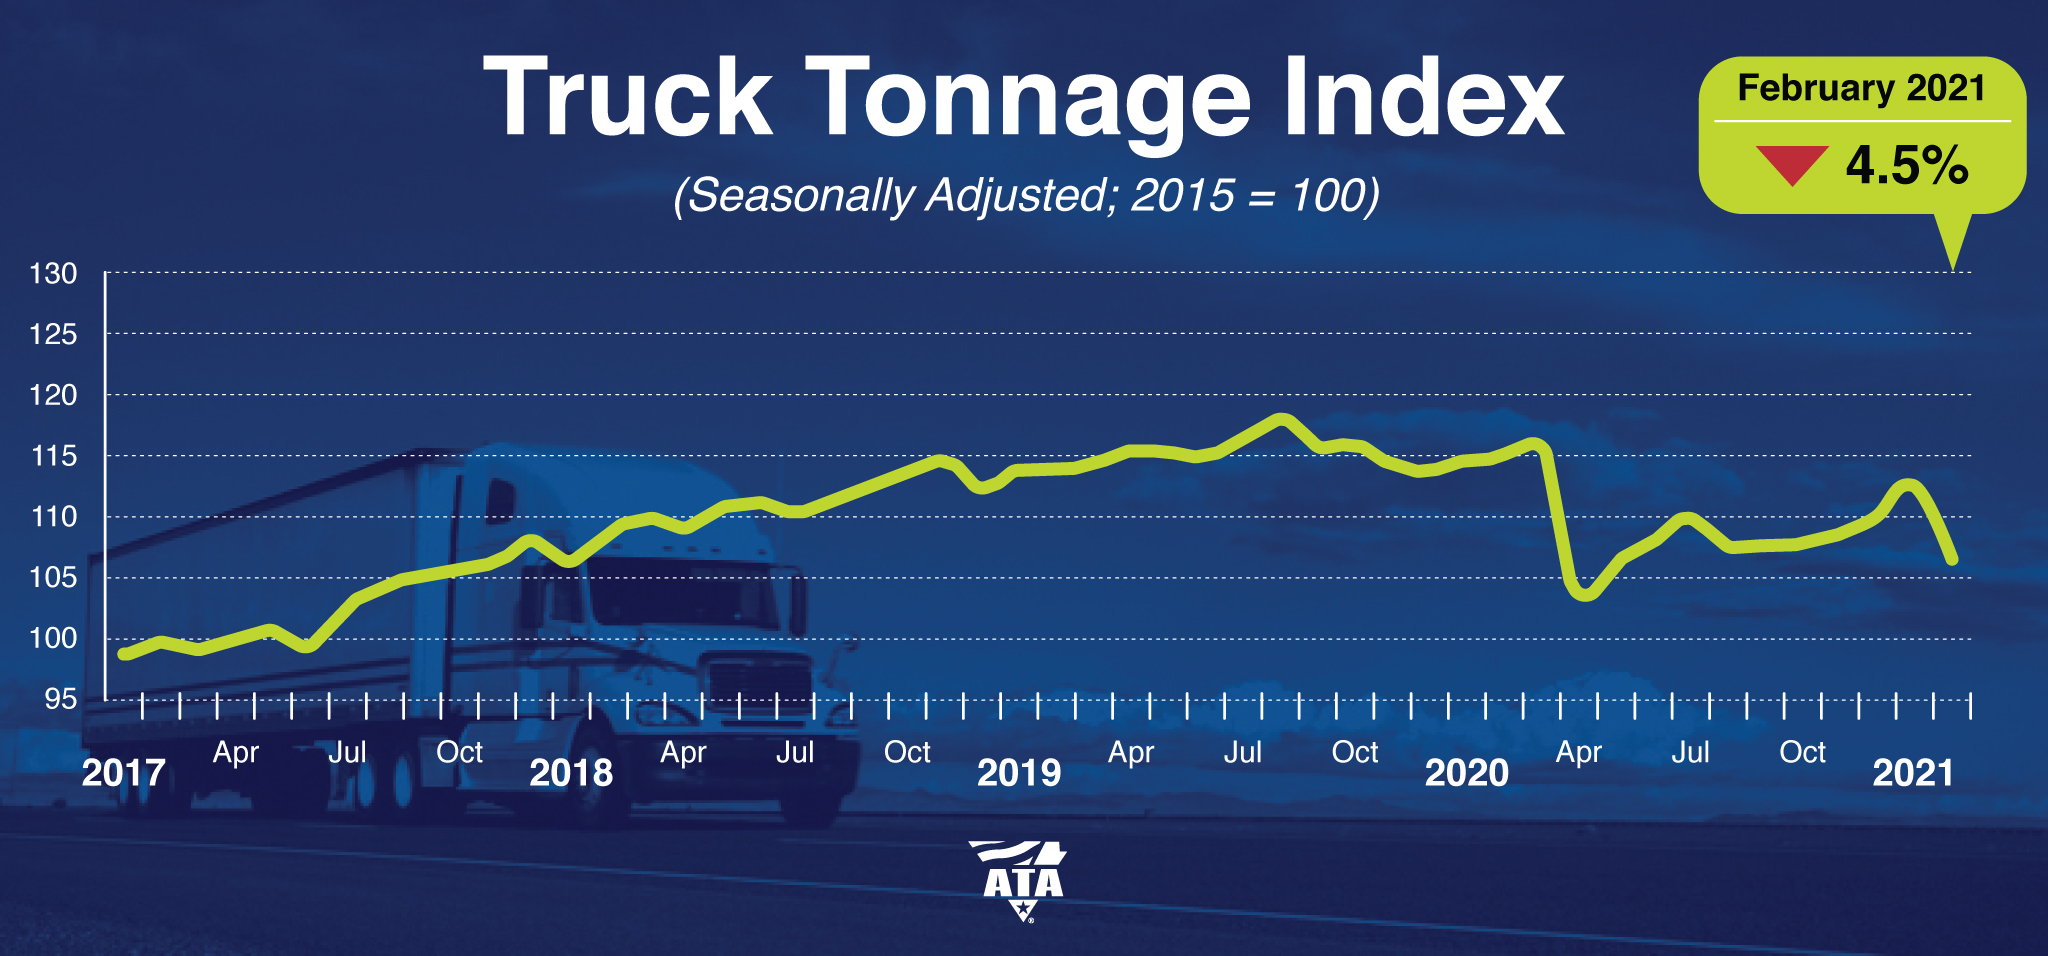
American Trucking Associations’ advanced seasonally adjusted (SA) For-Hire Truck Tonnage Index decreased 4.5% in February after rising 1.8% in January. In February, the index equaled 110 (2015=100) compared with 115.2 in January. Compared with February 2020, the SA index fell 5.9%, which was preceded by a 1.6% year-over-year decline in January. In 2020, the index was 4% below the 2019 average.
STR’s latest 51-chart demand map through 13 March 2021 shows that most states are moving closer to their levels from the same time last year. Unfortunately, those demand levels from comparable periods in 2020 were lowered substantially by the earliest pandemic lockdowns. A clear majority of states have made solid progress in shrinking the tremendous demand deficits that developed during the worst times of the pandemic. However, current bookings shortfalls from pre-pandemic times remain significant, particularly in a handful of states dominated by the largest urban markets.
Like most sports leagues, the NCAA has had to overcome much to execute a full season this year - the pandemic, shuttered schools, covid protocols. But, perseverance and determination has paid off as one of the most celebrated tournaments is set to begin - March Madness! And what accompanies a massive sports competition...Digital Ads, of course.
In-person supermarket visits in the EU are at their lowest point since the start of the pandemic, with trips reaching to a new low of just 34% of previous levels as coronavirus cases rise sharply in the region once again. Footfall to stores had tracked as high as 80% of usual levels at the start of the year before experiencing a sharp decline since February, which saw both France and Poland reintroducing partial lockdowns to fight a third wave.
Let’s begin today’s analysis and revelation with an encouraging quote from John F Kennedy: “When written in Chinese, the word crisis is composed of two characters — one represents danger, and the other represents opportunity.” Now that the tone has been set, we can reveal how some destinations are attracting longer stays as the prolonged pandemic discourages people from returning home to work from their gloomy homes. Why would you when sparkling Belize and the Canary Islands are on offer?
CE Transact data has tracked Kingfisher sales very well in the UK, with high correlations to reported results. Our recent launch of online vs. offline channel breakouts in the UK provides further insight into what has helped the home improvement retailer weather the COVID storm. While Kingfisher’s growth lagged overall UK Home & Garden spend throughout 2019, the company got a big boost during the pandemic. KGF sales grew over 30% y/y in May 2020 while overall Home & Garden was still declining, and outpaced industry growth when Home & Garden recovered to 28% growth in June.
There’s no doubt about it, the computer hardware industry came out on top during COVID-19. While people were stuck at home during the pandemic, there was a higher demand for computer hardware for people working at home. There was also more time for gamers to invest in better, faster gaming equipment. Using SimilarWeb’s alternative datasets, we can see that website traffic to the U.S. computer electronics hardware industry surged 48% year-over-year (YoY) in 4Q20. Indeed on a YoY basis, 1Q20 traffic dropped 4%, before rising 24% in Q2 and 32% in Q3.
U.S. consumer spending has been altered by the coronavirus pandemic. Our data reveals that consumers are changing the way they pay for goods and services, with some industries seeing spending shift toward online purchases. Additionally, the pandemic has changed the types of purchases consumers are making, with stimulus recipients increasing their spending on big-ticket items. By analyzing industry-level data, consumer spending trends can provide insight into which sectors of the economy are recovering fastest. Overall, consumer spending in February versus the same month in 2020 is up 13 percent across all sectors, an aggregation of over 5,200 major U.S. companies.
In our recent Energy Sector Jobs Report, we explore an industry in transition. The shift from traditional fossil fuels to renewable energy sources continues to gain momentum on the heels of a record-breaking year for clean energy installations and acquisitions. The report gives an overview of how job listings in the sector are changing, as well as which companies are growing and which are declining. To expand on this analysis, we decided to take a deep dive into a few standout companies identified in the report to see how their job listings and share prices have changed amid recent growth initiatives.
In spite of the confluence of the COVID-19 pandemic and high unemployment in 2020, the total number of home-purchase loan applications rose by 11% from 2019. The need for more space (to accommodate an office or school room from home), reduced need to commute and record-low mortgage interest rates influenced strong buyer demand and may have offered an opportunity to relocate to more affordable areas. According to CoreLogic data, homebuyers relocating to another metro were often choosing metros that are either adjacent to their current location, had a lower cost of living, or both.
Even before the pandemic, online mattress shopping was on the rise. According to the International Sleep Products Association, 45% of the mattresses purchased in 2018 were through online sales. Those numbers will surely be higher once 2020 is tallied. Online bed-in-a-box startups, of course, have been challenging the sleep status quo for years. Today there are over 200 online mattress retailers, one for every sleeper — no matter your preferred sleep position, size, material, type, and budget. There are even organic and eco-friendly options for a greener sleep.
Presence across UK quick-service restaurants is showing signs of awakening for the first time since the start of the current national lockdown, with high-frequency geo-location data recording an increase in attendance from a very low base. Although levels remain just a fraction of what they were before the pandemic – and have yet to climb higher than 11% of the January 2020 mean – the data shows how collections are driving footfall ahead of hospitality reopening on 12 April.
One of the businesses that has seen sales slowest to come back from the COVID-19 pandemic is movie theatres. Adding to the pain of government-mandated closures, many studios delayed releases and have begun releasing films in theatres on the same day as key streaming services. In today’s Insight Flash, we look at the recent premiere of Raya and the Last Dragon, which launched on Disney+ for a $29.99 supplementary charge on the same day it was out in theatres. We compare the movie’s in-theatre success to that of Tom and Jerry the week before, analyze Disney+ purchases vs. the fall release of Mulan, and examine prior Netflix price hikes to see if Disney+ is offering enough content to retain subscribers after its own price increase later this month.
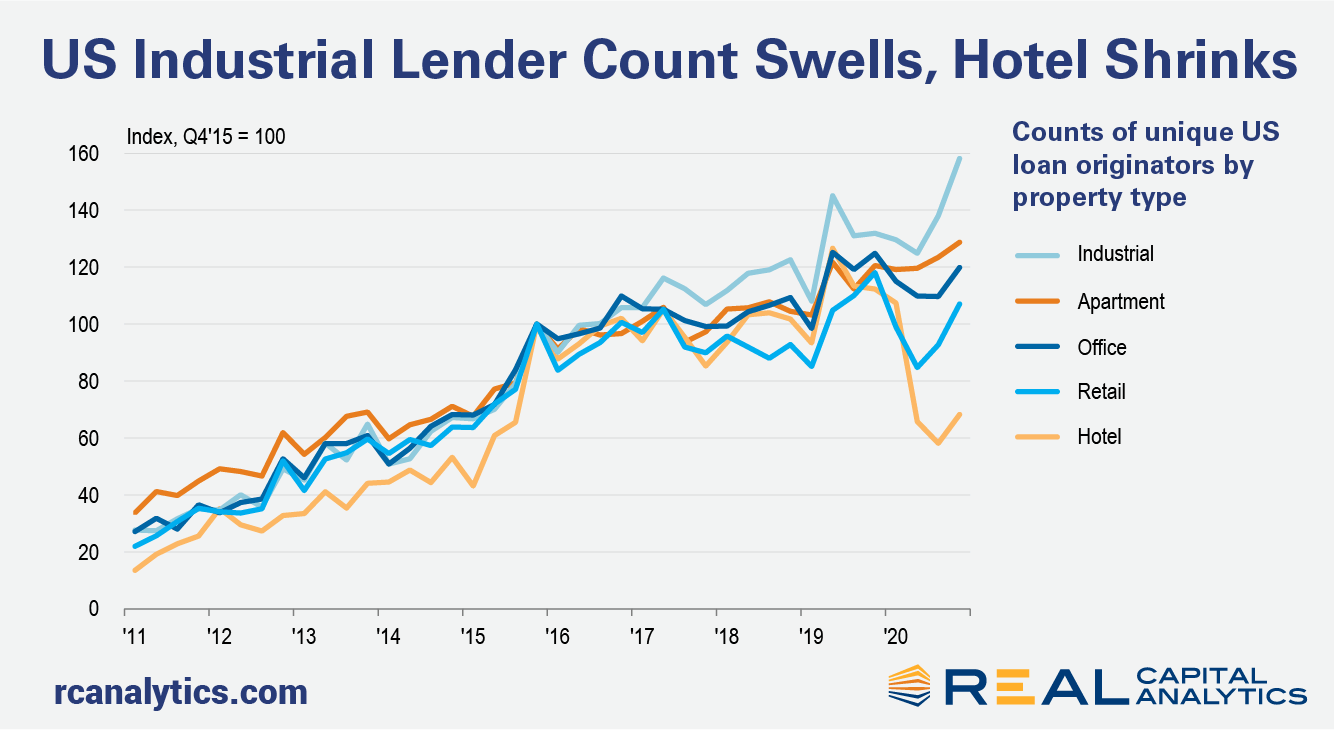
One year into the pandemic and clearly the current market downturn is not like the last one just over a decade ago. Commercial property prices have not been the adjustment mechanism for the disruptions from the pandemic — deal volume has suffered instead. A functioning debt market with far higher levels of liquidity than in the last crisis is a big part of the difference between these recessions. Liquidity is not just a story about volume. To measure trends in liquidity in the equity portion of the capital stack, Real Capital Analytics publishes a composite scoring system looking at numerous indicators that can influence a market.
As we pass the anniversary of the start of the pandemic (the WHO declared COVID-19 a pandemic on March 11th), and with over 20% of the US population now vaccinated with at least one dose as of March 14th, we examined how consumers have behaved from then to now. We look at consumer spending and foot traffic across the most and least vaccinated states, how new shoppers acquired during COVID are being retained across retailers, and how share of wallet has potentially changed over the past year.
The State of Mobile Gaming 2021 data proves that, yet again, games dominate the mobile app business. This is especially true when it comes to revenue. Consumers spent $143 billion on apps in 2020. Of that, $100 billion went on games. In other words, for every dollar spent on iOS and Google Play, games took 70 cents. Gaming also dominated the market in terms of downloads, although not to the same extent. 36% of all mobile app downloads in 2020 were games – that's 80 billion downloads out of 218 billion overall.
Realtime sales and inventory information can be useful to look at both short- and long-term trends. Previously, Viscacha has written about how long-term changes in weather factors like temperature impact sales by category. Here, we dive into the immediate effects of an extreme weather event on a home improvement retailer. Ace Hardware’s sales swung dramatically during Texas’s unusually harsh 2021 winter. Viscacha’s subscribers were able to see in real time which products and categories were spiking and by how much.