If you live in the United States and spend any time in front of a screen during election season, you’ve seen them: political ads. Ads sponsored by PACs and the political candidates themselves are a dime a dozen—but only to viewers. The ads themselves represent billions of dollars of ad spend thrown into digital, print, and tv ads supporting specific parties and candidates.
One of the most consequential elections in modern history, both the Presidential race and several Senate races could determine the course of the country for a generation. Moreover, the battle for votes has become a measurement of digital ad dollars. That makes Facebook, with over 190 million users, and Instagram, with 126 million users, prime territory for political ads.
The two Presidential candidates have little in common, from their stance on foreign policy and healthcare to their advertising strategies and messaging. One thing they do have in common, though? An affinity for mentioning one another in ads--Facebook ads, in particular.
Since The Queen’s Gambit debuted on Netflix, mobile chess games appearing at the top of app store search results, as a grouping, have increased their average daily downloads 63% in the United States and 11% worldwide. The percentage change looks at the average daily downloads of 10 days prior to debut compared with that of debut day plus 9 days after.
According to the data, reemergence marches on, slowly and subtly. We’re now in a phase where national changes to foot traffic are small to nonexistent for most categories. We quantify visitation trends by comparing a 7-day average volume of foot traffic to the 7 days prior. This metric removes blips and lets us measure how much foot traffic is increasing or decreasing over the past week.
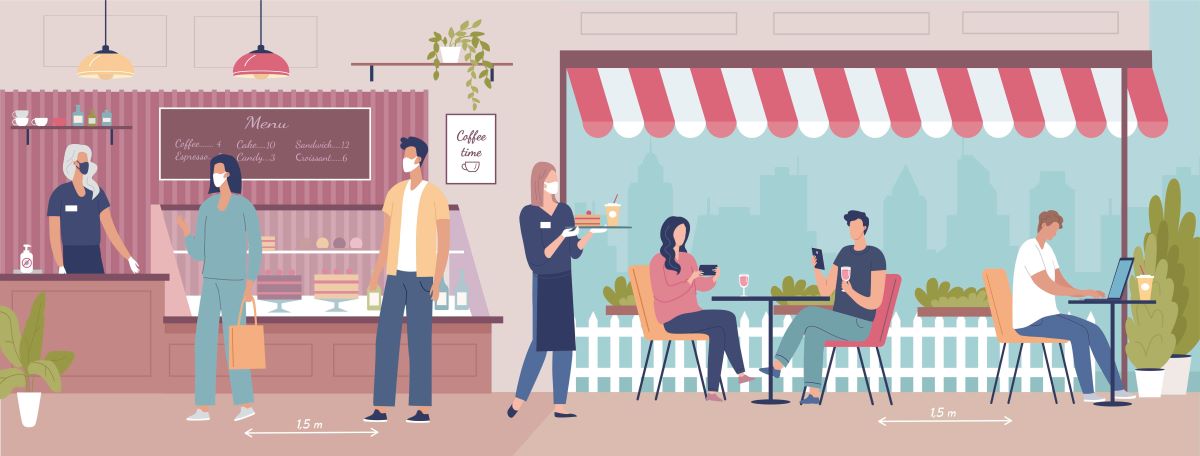
It goes without saying that the restaurant industry has been hit hard over the past seven months. Many are unsure what the future holds for in-person dining, or what they should be doing to adapt to the current conditions. To ease some of this uncertainty, we teamed up with location technology platform Foursquare to create a clear, comprehensive picture of the dining landscape.
Visits to National Trust properties are within touching distance of pre-Covid levels as restrictions on indoor entertainment encourage visitors out into the nation’s parks and gardens. The Huq Index measured a sharp drop in attendance to both open and ticketed properties with the onset of lockdown in March
The COVID-19 pandemic has done more than change consumer habits; it has resulted in a mass migration out of urban centers across the country. Using our Foot Traffic data, we analyzed migration patterns in and out of cities before and during the pandemic to understand just how this exodus occurred.
The world of work is always changing, but 2020 has brought unimaginable shifts in where and how many of us do our jobs. Although only 8% of employees worked remotely full-time prior to COVID-19, this number quadrupled to 35% by May 2020. So what have we learned from this massive experiment in working from home and how can these remote work insights shape the future of work?
The Trump campaign outspent Biden nearly two-fold from July through September. But, throughout September and October, we've seen the two campaigns battle public attention, starting with a series of back-to-back, YouTube takeovers, followed by a reported uptick in television ads from the Biden campaign.
In this Placer Bytes, we dive into the initial data from the reopening of the American Dream mall and a fitness player’s unique positioning. With many assuming the American Dream was going to be a flop, there are signs from the mall’s reopening that could be strong.
Mere weeks ahead of Election Day, a global pandemic continues apace, an economic and social justice crisis continues to roil the country and one of the most contentious Presidential races in American history is on the horizon. There has already been record turnout for early voting, however the candidates are still spending big to sway those who have not yet cast their ballots.
This week’s snapshot looks at the consumption of online health content and services in Europe. Our analysis includes statistics for France, Germany, Italy, Spain, and the UK, with EU5 averages for benchmarking purposes.
In April, we made the argument that fitness could be one of the sectors to bounce back fastest – a bold claim at the time. The idea was that an extended period of being “stuck at home” could actually increase our longing for the gym. But, after months of watching the sector struggle as a whole, we backtracked and left even the strongest players off of our updated expected 2020 winners list.
Campuses across the UK are fast becoming ghost towns as students swerve physical University attendance in favour of remote working. While Autumn traditionally sees universities buzzing with freshers week and the start of a new academic year, Huq’s data shows that attendance is struggling to get beyond 22% of normal term time.
During Covid, many countries experienced atypical visitation patterns. Some countries experienced a 50% decline in park traffic while others experienced an increase of up to 90% year-over-year. As people adjusted to the new normal there was an acceleration in park visitation globally. Meanwhile, park traffic in tourist destinations suffered more meaningfully.
For years, the US military has promoted the idea that the armed forces is an effective launching pad to leadership positions. We wanted to dig into this presumption and explore whether those with military backgrounds really get more senior positions once they enter the corporate world. By tracking the careers of both veterans and non-veterans, we see how military service affects seniority when compared to civilians.
As COVID-19 continues to affect so many aspects of life, disputes caused by COVID-19 have increased and evolved. Lex Machina is tracking cases that have been filed due to the coronavirus health crisis or related societal changes. Previously, we tracked new litigation caused by COVID-19 for federal district court cases filed March 1 through May 2, 2020 and provided an update looking at March 1 through July 4, 2020.
With a La Niña event already arriving, aWhere analysts reviewed what a typical La Niña year looks like in southern regions of South America. Looking at aWhere’s historical, observed data for the 2011-2012 La Niña event, we can better understand the implications for rainfall patterns and the challenges this region could face. Agriculture in this area is an important economic activity and it was greatly impacted by the 2011-2012 La Niña event. We will examine this in more depth in this report.
For decades, many states feared that they were losing their best talent to other states with prestigious universities. This “brain drain” as it’s been known to be called, has in part been attributed to the trend of people finding work close to where they attend school. By tracking individuals who provide information about their high school education, their college education, and their first job, we see a remarkable reversal of this trend.


