In this Placer Bytes, we dive into Starbucks and its impressive recovery and the resiliency of New York retail. As if another reminder was necessary, the latest metrics from Starbucks have reiterated the problematic nature of betting against the brand. Looking at weekly visits year over year shows that the significant declines seen throughout the pandemic have normalized with visits up throughout March. And while this is clearly a misleading metric, they do signify the rebound.
The headline numbers suggest that global airline capacity has seen a slight recovery back to 61.9 million seats this week, a 1.2% increase. However, as the weekly airline capacity was being finalized further significant capacity cuts were yet to be supplied by many of the major Indian airlines and Fiji was about to enter a lockdown; the Fiji numbers are minor but India normally accounts for around 2.6 million seats so in truth global airline capacity is probably down week on week. Hopes for that airline capacity bounce we are all hoping for and subsequent release of pent-up demand remain some way off.
Non-essential retail in Portsmouth was among the busiest in the South East of England after non-essential retail reopened on April 12th, with data from Huq Industries’ Community Vision product revealing the cities that bounced back fastest in the first full week. Community Vision, Huq’s high-street measurement tool for local Councils, measures footfall, catchments and other essential KPIs in order that towns and cities can follow and optimise the recovery from Covid-19 on a near-realtime basis.
Poshmark has been making its mark on luxury retail by providing a popular marketplace for both reselling goods and listing new items. With the company newly launched as part of our CE Web data to complement our existing CE Transact offering, in today’s Insight Flash we dig into trends vs. the larger consignment space, how the company has performed vs. its largest competitors, and what average selling price looks like by department.
With international and business travel caught in the everchanging crossfire of quarantine rules and other COVID-19 restrictions, staycations became a significant driver of the occupancy gains that have emerged since the beginning of the pandemic. STR’s Tourism Consumer Insights team continues to keep a close eye on traveler and tourism trends as the industry moves through the most optimistic point of the pandemic. The twists and turns of the pandemic have contributed to seismic changes in tourism. In this latest installment of our Tourism After Lockdown blog series, we evaluate post-pandemic recovery scenarios for domestic and international leisure travel.
Shortly before shelter-in-place orders went into effect in March 2020, many retailers experienced the mad dash of customers stockpiling toilet paper. As supply ran out in brick-and-mortar stores, some consumers turned to DTC companies—such as Who Gives a Crap and Tushy—that offer bathroom products. Who Gives a Crap sells bamboo and recycled toilet paper as well as tissues, while Tushy sells bidets, bamboo toilet paper, and other bathroom accessories. Both of these DTC toilet paper companies saw strong growth in March and April of 2020. New consumer spending data reveals how Tushy and Who Gives A Crap have fared in the year since the initial panic-buying phenomenon.
According to ATTOM Data Solutions’ newly released Q1 2021 Special Report, spotlighting county-level housing markets around the U.S. that are more or less vulnerable to the impact of the virus pandemic, states along the East Coast, as well as Illinois, were most at risk in Q1 2021 – with clusters in the New York City, Chicago and southern Florida areas – while the West continued to face less risk. ATTOM’s most recent Coronavirus housing impact analysis revealed that first-quarter trends generally continued those found in 2020, but with smaller concentrations around several major metro areas. The reported noted the number of counties among the top 50 most at-risk was down in the New York, NY; Philadelphia, PA and Washington, D.C. metro areas.
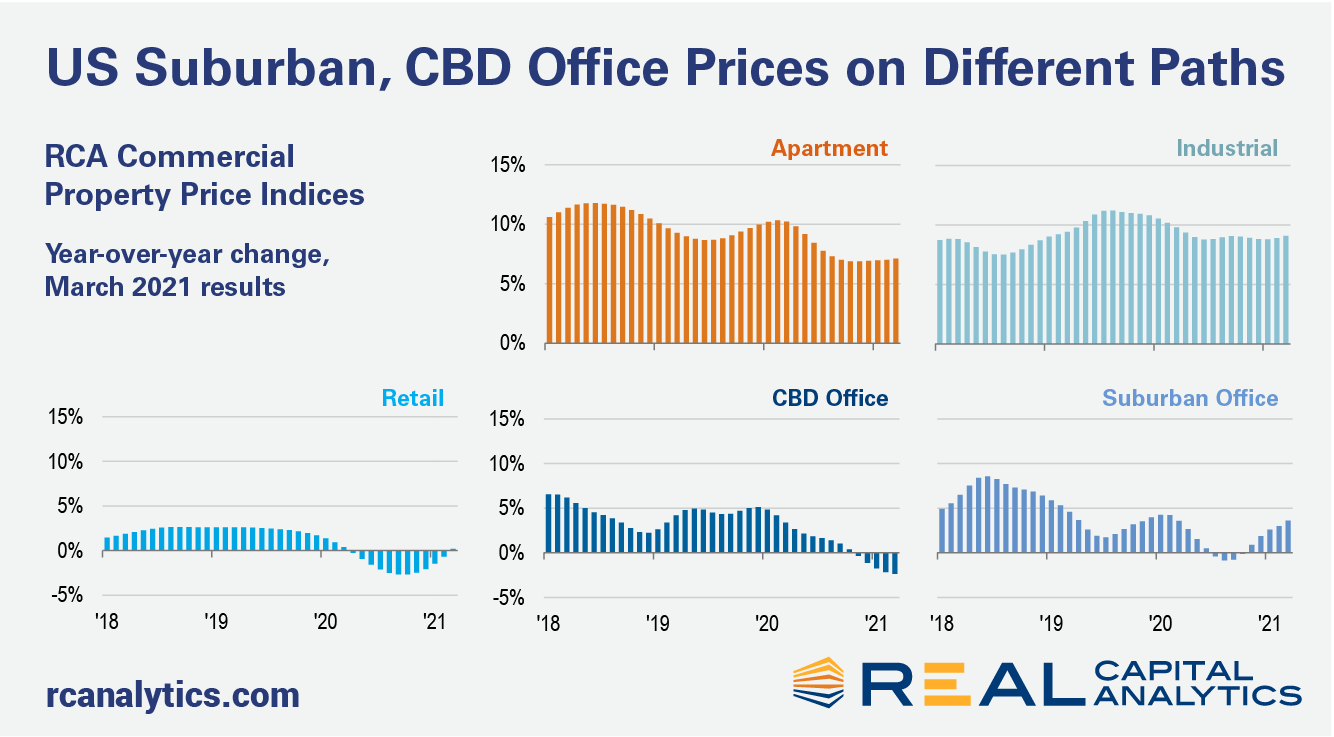
The headline annual rate of U.S. commercial property price growth posted a stronger gain in March, aided by industrial, apartment, and suburban office price increases, the latest RCA CPPI: US summary report shows. The office sector subtypes continued to move in opposite directions in March. The CBD index declined 2.4% year-over-year, while suburban office accelerated to a 3.6% annual pace of growth. The differing paces reflect the recent outperformance in suburban deal activity, as shown in the new edition of US Capital Trends, also released this week.
From serving as the one-year mark since the onset of the pandemic in the U.S. to potentially highlighting the beginning of retail’s return to normalcy, Q1 was very important. One of the most significant trends in Q1 retail was signs that normal shopping patterns were returning. In the apparel space, our Q1 Quarterly Index showed that weekend visit percentage rose for the third quarter in a row with a quarter-over-quarter jump of 10%. This is critical as many apparel players rely on shoppers being willing to spend more time getting to a regional mall in order to drive sales.
2021 offers a promising year for video game publishers following last year’s releases of the new PlayStation 5 and Xbox Series X, as well as highly anticipated games like Animal Crossing: New Horizons and Immortals: Fenyx Rising. Our previous gaming research demonstrated how demand and online sales of video games increased amid the pandemic as people settled into life indoors and sought entertainment. To see how sales among console and PC game publishers are trending, Edison Trends analyzed over 1.5 million transactions.
In the last year, online spending on gaming subscriptions grew 91% at Nintendo Switch Online and 16% at Sony's Playstation Plus and Playstation Now combined. Spending on Microsoft's Xbox Live and Game Pass has fallen in the last year. The PlayStation Store led in total online consumer spend on console and PC video game products. Xbox Live and the Microsoft Store combined saw 81%, Nintendo Store 35%, and Steam 32% of the online consumer spend that PlayStation Store earned in the last year. GameStop saw the highest growth in online spend with a 128% increase in February 2021 vs February 2020. Steam and the Nintendo store followed, each with 109%.
With a year passed since the start of the pandemic, people have shifted where they work, travel, and live. Using our foot traffic data, we refreshed our October analysis on the COVID-driven Urban Exodus, and analyzed whether this migration out of urban centers has continued to last, or whether people are now returning back to their pre-COVID urban life. We looked at particular urban cohorts pre-pandemic, and analyzed what share of each cohort moved away, where they moved to, and how many have since returned. We replicated this analysis in the prior year (i.e. cohorts from before March 2019) in order to establish and compare the COVID-driven migration and return to a benchmark of “normal” migration patterns exhibited in the data. We believe that the difference between 2020 vs. 2019’s migration is the appropriate way to measure any COVID-driven changes, and is the methodology we employ throughout the analysis.
Luxury names have seen strong growth in the US as stimulus checks have gone towards splurge purchases like handbags. At the same time, new lockdowns and minimal tourism have put a strain on their European businesses. And while European retailers like LVMH have reported strong results, how will US-based companies like Tapestry fare? Today’s Insight Flash takes advantage of strong correlations in our CE Transact data for Tapestry DTC sales in both the US and UK to examine trends across its brand portfolio in both countries, including spend by brand and average ticket differences.
Last week, Coinbase (COIN) IPO’d. This highly anticipated event exceeded expectations, as Coinbase’s valuation reached over $80 billion after its first day of public trading. It also marked a turning point for cryptocurrency, which is now well on its way to wide acceptance. In its first week as a public company, Coinbase’s four main apps were downloaded about 2.7M times total, 2.3M of which were for its Coinbase - Buy & Sell Bitcoin app. All of its apps, except Coinbase Card, broke their lifetime records for single-day downloads and daily active users (DAU).
Here we dive into the digital health of three major tech stocks: Facebook (FB), Twitter (TWTR), and Microsoft (MSFT). What do the online trends reveal about these mega-caps? Using our powerful alternative data, we reveal the key digital insights heading into the print. Let’s take a closer look at these internet giants now.
Consumer transaction data reveals that theme parks across the U. S. have been on the road to recovery, with both ticket sales and customer counts on the rise, after having been hit hard by shelter-in-place orders in March 2020. The industry witnessed a 55 percent decline in sales year-over-year in March 2020, and has since bounced back with 92 percent year-over-year sales growth in March 2021. Theme parks saw observed customers fall by a lesser magnitude year-over-year between April to September of 2020. The monthly average year-over-year growth in observed customers stood at -69 percent compared to -77 percent for observed sales, a trend that was perhaps due to parks looking to alternative ways of maintaining customer traffic, like Disney World’s NBA bubble.
U.S. commercial real estate activity rose in March compared to a year ago, with deal volume increases seen for most of the major property sectors, the latest edition of US Capital Trends shows. For the first quarter in total, deal activity dropped by nearly 30% compared to Q1 2020. March deal volume increased 11% versus March 2020 when the Covid crisis first erupted and cracks started to show in U.S. deal activity.
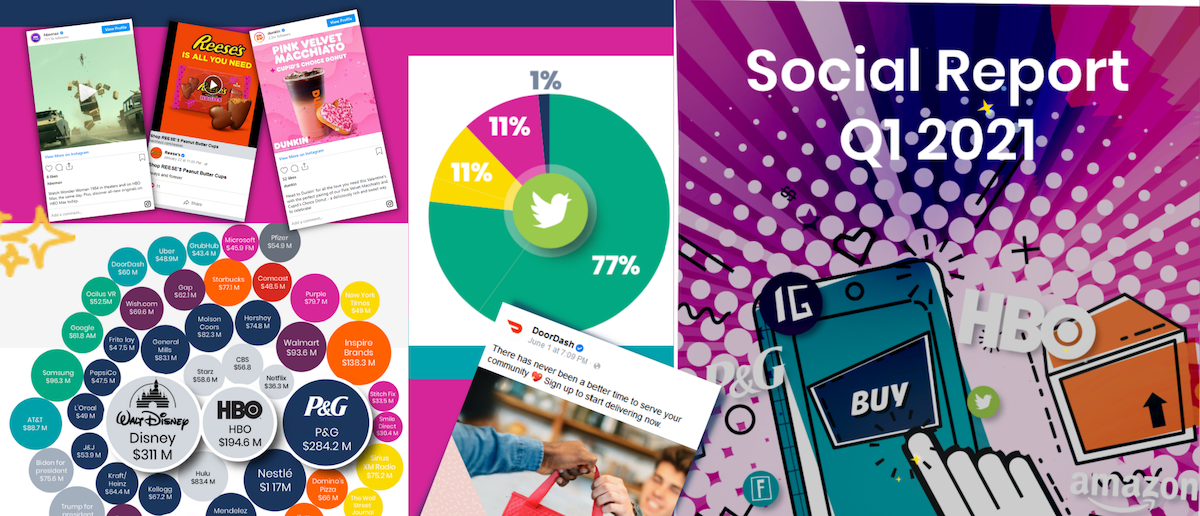
As we Tweet and ‘gram our way into another year, social advertising remains a top focus for brands. In fact, top advertisers across verticals spending an average of 60-70% of digital budgets on social channels. But after a year fraught with a pandemic, a presidential election, and continued conversations of racial and social injustice, advertisers have been faced with a choice to join the conversation, or stay silent.
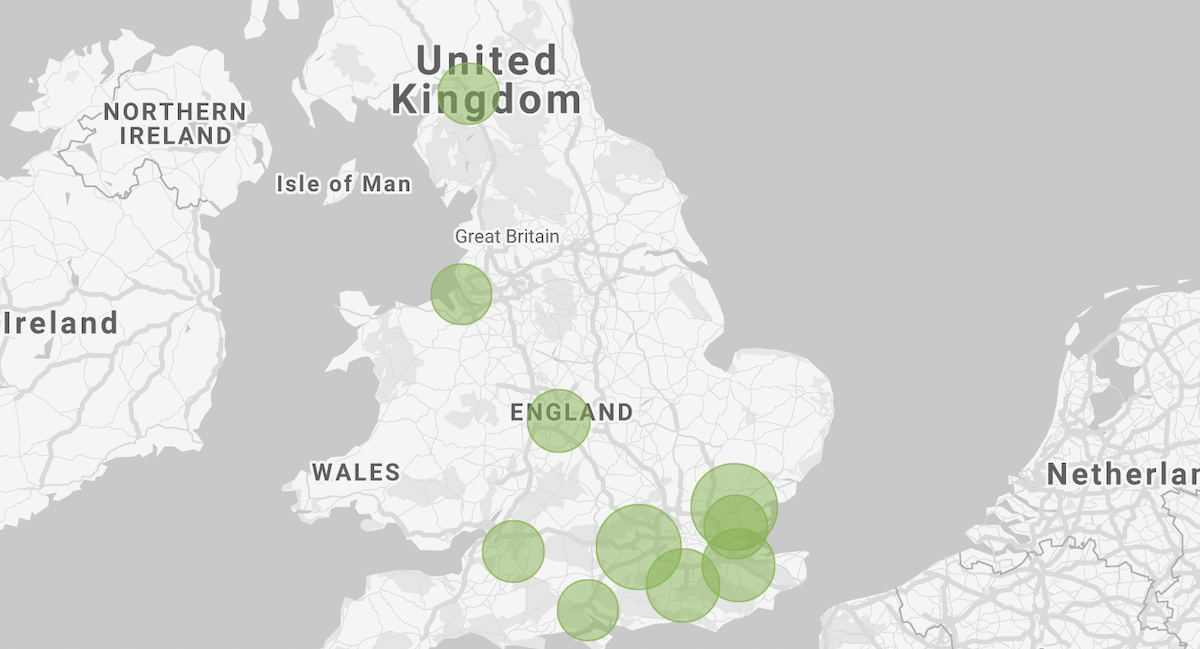
To mark the re-opening of non-essential retail last week, Huq has used insights from Community Vision, it’s high-street measurement tool for local Councils, to chart the recovery of the top and bottom towns and cities across England and Wales. The data measures both pedestrian footfall and in-store visits to non-essential outlets across 10,000+ high-streets between Monday 5th and Saturday 17th April, aggregated to the city level. Chelmsford in Essex has topped the list for footfall growth since non-essential retail’s reopening, with an increase of 71.9% over the first week. However, while Chelmsford has been busy in terms of footfall, Exeter has in fact seen the greatest rise in non-essential store visits, with levels almost tripling in the week (up 227.3%) – albeit from a small base.
In this month’s ALN newsletter, first quarter multifamily performance was evaluated. One interesting perspective that was not covered was a look at the quarter by market tier. ALN assigns each market to one of four tiers based on the level of multifamily stock in the market, with Tier One markets being the 33 largest in the US and markets decreasing in size down to Tier Four. Considering only conventional properties of at least 50 units, let’s take a closer look at how these market tiers performed to start 2021.